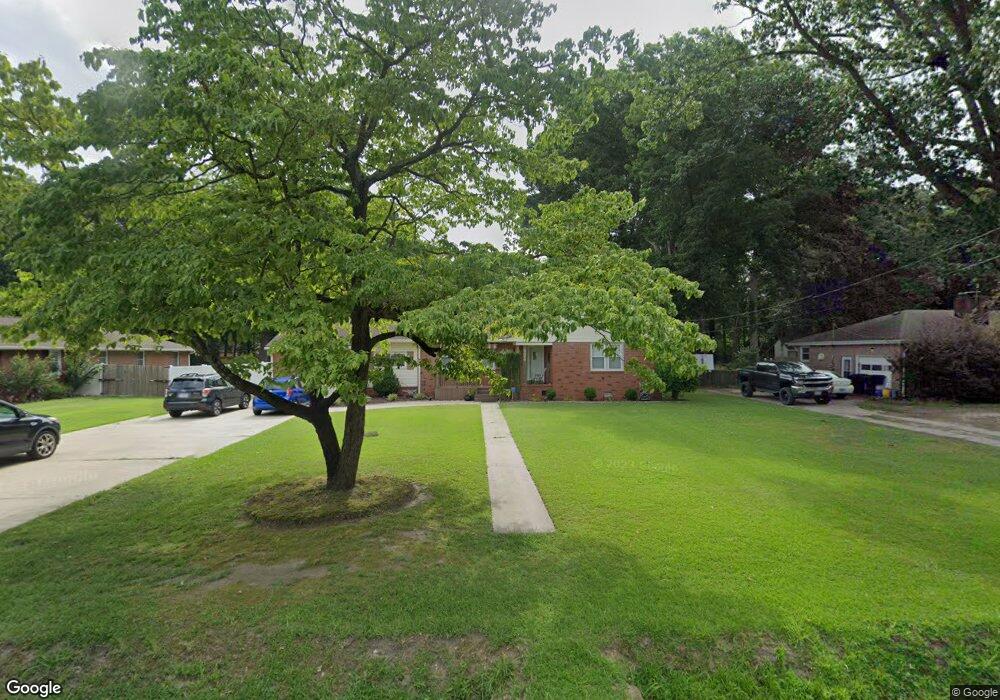
3629 Moore Rd Portsmouth, VA 23703
Churchland NeighborhoodEstimated Value: $326,000 - $394,000
3
Beds
2
Baths
2,185
Sq Ft
$171/Sq Ft
Est. Value
About This Home
This home is located at 3629 Moore Rd, Portsmouth, VA 23703 and is currently estimated at $374,348, approximately $171 per square foot. 3629 Moore Rd is a home located in Portsmouth City with nearby schools including Churchland Elementary School, Churchland Academy Elementary School, and Churchland Middle School.
Ownership History
Date
Name
Owned For
Owner Type
Purchase Details
Closed on
Feb 5, 2016
Sold by
Futch Kendra
Bought by
Futch James R and Futch Kendra A
Current Estimated Value
Home Financials for this Owner
Home Financials are based on the most recent Mortgage that was taken out on this home.
Original Mortgage
$75,000
Outstanding Balance
$63,291
Interest Rate
3.97%
Mortgage Type
Credit Line Revolving
Estimated Equity
$311,057
Purchase Details
Closed on
Jun 30, 2014
Sold by
Allen Kenneth C
Bought by
Futch Kendra
Create a Home Valuation Report for This Property
The Home Valuation Report is an in-depth analysis detailing your home's value as well as a comparison with similar homes in the area
Home Values in the Area
Average Home Value in this Area
Purchase History
| Date | Buyer | Sale Price | Title Company |
|---|---|---|---|
| Futch James R | -- | None Available | |
| Futch Kendra | -- | -- |
Source: Public Records
Mortgage History
| Date | Status | Borrower | Loan Amount |
|---|---|---|---|
| Open | Futch James R | $75,000 |
Source: Public Records
Tax History Compared to Growth
Tax History
| Year | Tax Paid | Tax Assessment Tax Assessment Total Assessment is a certain percentage of the fair market value that is determined by local assessors to be the total taxable value of land and additions on the property. | Land | Improvement |
|---|---|---|---|---|
| 2025 | $4,408 | $350,070 | $127,310 | $222,760 |
| 2024 | $4,408 | $342,400 | $127,310 | $215,090 |
| 2023 | $4,037 | $322,940 | $127,310 | $195,630 |
| 2022 | $3,877 | $298,220 | $110,700 | $187,520 |
| 2021 | $3,391 | $260,870 | $66,860 | $194,010 |
| 2020 | $3,350 | $257,690 | $63,680 | $194,010 |
| 2019 | $3,329 | $256,070 | $63,680 | $192,390 |
| 2018 | $3,139 | $241,470 | $63,680 | $177,790 |
| 2017 | $3,097 | $238,230 | $63,680 | $174,550 |
| 2016 | $3,097 | $238,230 | $63,680 | $174,550 |
| 2015 | $3,045 | $234,230 | $63,680 | $170,550 |
| 2014 | $2,975 | $234,230 | $63,680 | $170,550 |
Source: Public Records
Map
Nearby Homes
- 3604 Lilac Dr
- 5806 Fawkes St
- 5516 Bingham Dr
- 3616 Bowden St
- 5911 Dunkirk St
- 3315 Camellia Dr
- 6002 Campbell St
- 6015 Arthur Ave
- 3433 Willow Breeze Dr
- 6205 Dunkirk St
- 3604 Pierce St
- 10AC Cedar Ln
- 4008 Oakhurst Rd
- 5807 Dunkin St
- 3660B Towne Point Rd Unit A
- 3860 Sugar Creek Cir
- 3432 Carter Rd
- 4959 Briarwood Ln
- 4955 Briarwood Ln
- 4100 Mayfair Way