363 Bob Dr Cincinnati, OH 45238
Delshire NeighborhoodEstimated Value: $194,000 - $207,000
About This Home
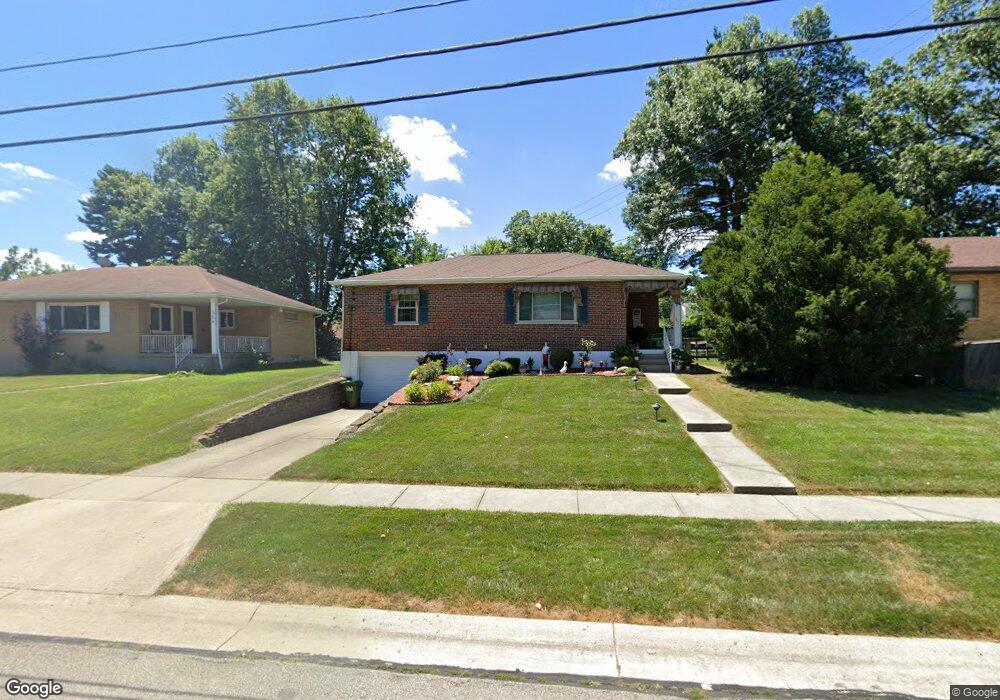
This home is located at 363 Bob Dr, Cincinnati, OH 45238 and is currently estimated at $200,237, approximately $185 per square foot. 363 Bob Dr is a home located in Hamilton County with nearby schools including Delshire Elementary School, Delhi Middle School, and Oak Hills High School.
Ownership History
We collect this data history from publicly available records. To have your information removed, we recommend requesting removal directly through your county’s website.
Purchase Details
Home Financials for this Owner
Home Financials are based on the most recent Mortgage that was taken out on this home.Home Values in the Area
Average Home Value in this Area
Purchase History
We collect this data history from publicly available records. To have your information removed, we recommend requesting removal directly through your county’s website.
| Date | Buyer | Sale Price | Title Company |
|---|---|---|---|
| $102,500 | First Title Agency Inc |
Mortgage History
We collect this data history from publicly available records. To have your information removed, we recommend requesting removal directly through your county’s website.
| Date | Status | Borrower | Loan Amount |
|---|---|---|---|
| Open | $82,000 |
Tax History
We collect this data history from publicly available records. To have your information removed, we recommend requesting removal directly through your county’s website.
| Year | Tax Paid | Tax Assessment Tax Assessment Total Assessment is a certain percentage of the fair market value that is determined by local assessors to be the total taxable value of land and additions on the property. | Land | Improvement |
|---|---|---|---|---|
| 2025 | $2,640 | $44,440 | $10,353 | $34,087 |
| 2024 | $2,576 | $44,440 | $10,353 | $34,087 |
| 2023 | $2,584 | $44,440 | $10,353 | $34,087 |
| 2022 | $1,861 | $28,445 | $9,261 | $19,184 |
| 2021 | $1,822 | $28,445 | $9,261 | $19,184 |
| 2020 | $1,848 | $28,445 | $9,261 | $19,184 |
| 2019 | $1,773 | $24,522 | $7,984 | $16,538 |
| 2018 | $1,775 | $24,522 | $7,984 | $16,538 |
| 2017 | $1,602 | $24,522 | $7,984 | $16,538 |
| 2016 | $1,661 | $25,466 | $8,365 | $17,101 |
| 2015 | $1,663 | $25,466 | $8,365 | $17,101 |
| 2014 | $1,665 | $25,466 | $8,365 | $17,101 |
| 2013 | $1,649 | $26,807 | $8,806 | $18,001 |
Map
- 337 Greenwell Ave
- 4805 Mayhew Ave
- 4447 Mayhew Ave
- 439 Pedretti Ave
- 5060 Mount Alverno Rd
- 250 Greenwell Ave
- 253 Greenwell Ave
- 263 Clareknoll Ct
- 493 Pedretti Ave
- 358 Glen Oaks Dr
- 4297 Champdale Ln
- 4294 Mayhew Ave
- 5110 Chantilly Dr
- 4729 Shadylawn Terrace
- 4274 Paul Rd
- 4307 Copperfield Ln
- 4563 Foley Rd
- 224 Sebastian Ct
- 567 Greenwell Ave
- 576 Claymore Terrace
Ask me questions while you tour the home.