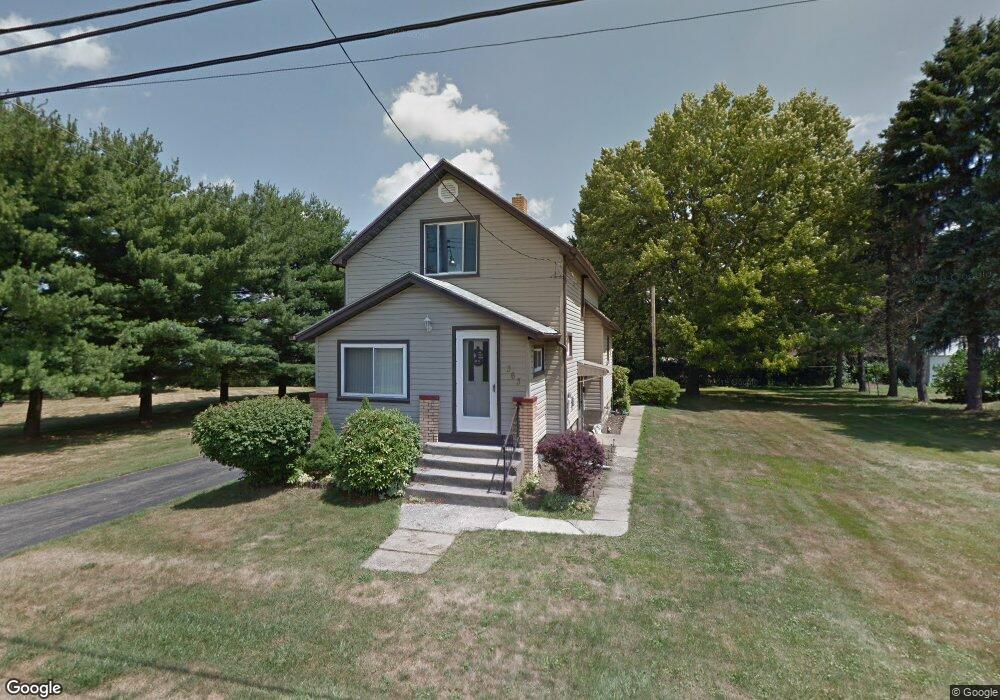
363 Caroline Ave Hubbard, OH 44425
Estimated Value: $94,000 - $150,000
2
Beds
1
Bath
1,106
Sq Ft
$113/Sq Ft
Est. Value
About This Home
This home is located at 363 Caroline Ave, Hubbard, OH 44425 and is currently estimated at $125,109, approximately $113 per square foot. 363 Caroline Ave is a home located in Trumbull County with nearby schools including Hubbard Elementary School, Hubbard Middle School, and Hubbard High School.
Ownership History
Date
Name
Owned For
Owner Type
Purchase Details
Closed on
Sep 9, 2010
Sold by
Jpmorgan Chase Bank National Association
Bought by
Foster Jeffrey S
Current Estimated Value
Home Financials for this Owner
Home Financials are based on the most recent Mortgage that was taken out on this home.
Original Mortgage
$27,600
Outstanding Balance
$18,151
Interest Rate
4.36%
Mortgage Type
New Conventional
Estimated Equity
$106,958
Purchase Details
Closed on
Mar 26, 2010
Sold by
Beck Elizabeth B and The Bank Of New York Mellon
Bought by
Jpmorgan Chase Bank National Association
Purchase Details
Closed on
Oct 20, 2004
Sold by
Gaibis Elizabeth and Beck Elizabeth B
Bought by
Beck Elizabeth B
Purchase Details
Closed on
Sep 24, 2004
Sold by
Gaibis Elizabeth and Beck Elizabeth B
Bought by
Beck Elizabeth B
Purchase Details
Closed on
Jan 1, 1990
Bought by
David David P and David E
Create a Home Valuation Report for This Property
The Home Valuation Report is an in-depth analysis detailing your home's value as well as a comparison with similar homes in the area
Home Values in the Area
Average Home Value in this Area
Purchase History
| Date | Buyer | Sale Price | Title Company |
|---|---|---|---|
| Foster Jeffrey S | $34,500 | None Available | |
| Jpmorgan Chase Bank National Association | $46,000 | Attorney | |
| Beck Elizabeth B | -- | -- | |
| Beck Elizabeth B | -- | -- | |
| David David P | -- | -- |
Source: Public Records
Mortgage History
| Date | Status | Borrower | Loan Amount |
|---|---|---|---|
| Open | Foster Jeffrey S | $27,600 |
Source: Public Records
Tax History Compared to Growth
Tax History
| Year | Tax Paid | Tax Assessment Tax Assessment Total Assessment is a certain percentage of the fair market value that is determined by local assessors to be the total taxable value of land and additions on the property. | Land | Improvement |
|---|---|---|---|---|
| 2024 | $1,972 | $40,390 | $9,800 | $30,590 |
| 2023 | $1,972 | $40,390 | $9,800 | $30,590 |
| 2022 | $1,414 | $26,400 | $8,860 | $17,540 |
| 2021 | $1,420 | $26,400 | $8,860 | $17,540 |
| 2020 | $1,427 | $26,400 | $8,860 | $17,540 |
| 2019 | $1,408 | $24,960 | $8,860 | $16,100 |
| 2018 | $1,403 | $24,960 | $8,860 | $16,100 |
| 2017 | $1,399 | $24,960 | $8,860 | $16,100 |
| 2016 | $1,238 | $23,490 | $8,860 | $14,630 |
| 2015 | $1,243 | $23,490 | $8,860 | $14,630 |
| 2014 | $1,214 | $23,490 | $8,860 | $14,630 |
| 2013 | $1,212 | $23,490 | $8,860 | $14,630 |
Source: Public Records
Map
Nearby Homes
- 124 Rebecca Ave
- 312 W Park Ave
- 191 Maple Leaf Dr
- 323 W Liberty St
- 110 School St
- 160 Hager St
- 203 Hager St
- 132 Drummond Ave
- 138 Moore St
- 28 Spring St
- 366 Westview Ave
- 3234 Bell Wick Rd
- 652 Meadowland Dr
- 351 Elmwood Dr
- 239 Elmwood Dr
- 381 Lauretta Ln
- 1034 Doris Dr
- 2687 Seifert-Lewis Rd
- 6982 Mcclure Rd
- 5950 Mount Everett Rd
- 349 Caroline Ave
- 366 Rebecca Ave
- 360 Rebecca Ave
- 374 Rebecca Ave
- 352 Rebecca Ave
- 337 Caroline Ave
- 370 Caroline Ave
- 411 Caroline Ave
- 402 Rebecca Ave
- 402 Caroline Ave
- 402 Caroline Ave Unit 10
- 402 Caroline Ave Unit 12
- 402 Caroline Ave Unit 11
- 402 Caroline Ave Unit 9
- 344 Rebecca Ave
- 350 Caroline Ave
- 327 Caroline Ave
- 410 Rebecca Ave
- 336 Rebecca Ave
- 340 Caroline Ave