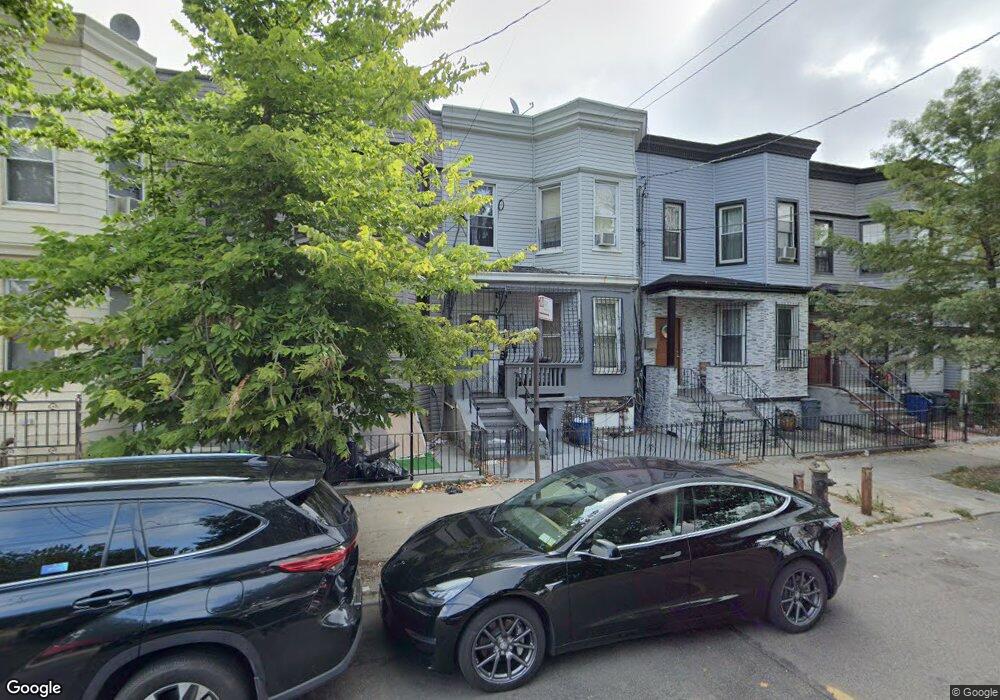
363 Euclid Ave Brooklyn, NY 11208
East New York NeighborhoodEstimated Value: $627,000 - $965,000
Studio
--
Bath
1,408
Sq Ft
$577/Sq Ft
Est. Value
About This Home
This home is located at 363 Euclid Ave, Brooklyn, NY 11208 and is currently estimated at $812,052, approximately $576 per square foot. 363 Euclid Ave is a home located in Kings County with nearby schools including P.S. 214 - Michael Friedsam, Cypress Hills Ascend Charter Lower School, and East Brooklyn Ascend.
Ownership History
Date
Name
Owned For
Owner Type
Purchase Details
Closed on
Oct 5, 2007
Sold by
Horne Ronald I
Bought by
Horne Ronald I and Small Ovid
Current Estimated Value
Purchase Details
Closed on
Nov 16, 2005
Sold by
Small Elaine K and Small Ovid
Bought by
Horne Ronald I
Purchase Details
Closed on
May 20, 2005
Sold by
Small Elaine K
Bought by
Elaine Small K and Small Ovid
Purchase Details
Closed on
Dec 28, 2000
Sold by
Rivera Julian
Bought by
Singh Deodat and Raghunath Heeramatie P
Home Financials for this Owner
Home Financials are based on the most recent Mortgage that was taken out on this home.
Original Mortgage
$149,150
Outstanding Balance
$53,546
Interest Rate
7.52%
Estimated Equity
$758,506
Create a Home Valuation Report for This Property
The Home Valuation Report is an in-depth analysis detailing your home's value as well as a comparison with similar homes in the area
Home Values in the Area
Average Home Value in this Area
Purchase History
| Date | Buyer | Sale Price | Title Company |
|---|---|---|---|
| Horne Ronald I | -- | -- | |
| Horne Ronald I | -- | -- | |
| Horne Ronald I | -- | -- | |
| Horne Ronald I | -- | -- | |
| Elaine Small K | -- | -- | |
| Elaine Small K | -- | -- | |
| Singh Deodat | $157,000 | Chicago Title Insurance Co | |
| Singh Deodat | $157,000 | Chicago Title Insurance Co |
Source: Public Records
Mortgage History
| Date | Status | Borrower | Loan Amount |
|---|---|---|---|
| Open | Singh Deodat | $149,150 | |
| Closed | Singh Deodat | $149,150 | |
| Closed | Elaine Small K | $0 |
Source: Public Records
Tax History
| Year | Tax Paid | Tax Assessment Tax Assessment Total Assessment is a certain percentage of the fair market value that is determined by local assessors to be the total taxable value of land and additions on the property. | Land | Improvement |
|---|---|---|---|---|
| 2025 | $4,749 | $46,500 | $13,440 | $33,060 |
| 2024 | $4,749 | $36,720 | $13,440 | $23,280 |
| 2023 | $4,758 | $43,260 | $13,440 | $29,820 |
| 2022 | $4,413 | $39,360 | $13,440 | $25,920 |
| 2021 | $4,396 | $31,140 | $13,440 | $17,700 |
| 2020 | $2,183 | $28,320 | $13,440 | $14,880 |
| 2019 | $4,122 | $31,080 | $13,440 | $17,640 |
| 2018 | $3,980 | $19,522 | $12,215 | $7,307 |
| 2017 | $3,755 | $18,420 | $9,618 | $8,802 |
| 2016 | $3,480 | $17,406 | $9,174 | $8,232 |
| 2015 | $2,096 | $17,391 | $11,735 | $5,656 |
| 2014 | $2,096 | $16,420 | $10,170 | $6,250 |
Source: Public Records
Map
Nearby Homes
Your Personal Tour Guide
Ask me questions while you tour the home.