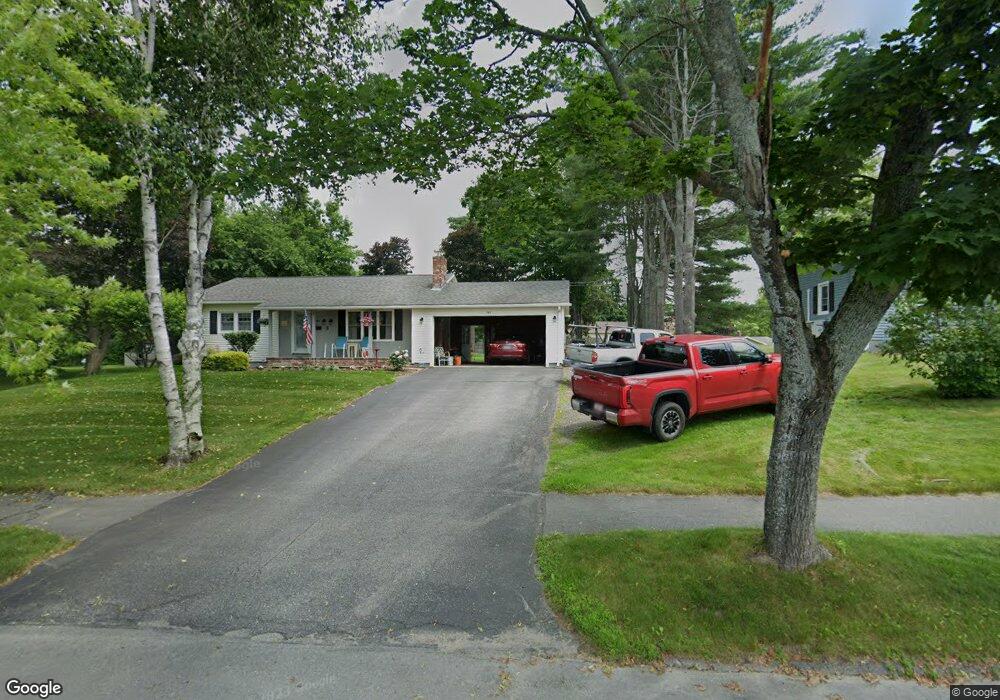
363 Fern St Bangor, ME 04401
Central Bangor NeighborhoodEstimated Value: $272,000 - $306,493
2
Beds
2
Baths
1,064
Sq Ft
$270/Sq Ft
Est. Value
About This Home
This home is located at 363 Fern St, Bangor, ME 04401 and is currently estimated at $287,373, approximately $270 per square foot. 363 Fern St is a home located in Penobscot County with nearby schools including Fruit Street School, Mary Snow School, and William S. Cohen School.
Ownership History
Date
Name
Owned For
Owner Type
Purchase Details
Closed on
Aug 19, 2015
Sold by
Gary Richard A
Bought by
Dinsmore Frank B and Dinsmore Janie C
Current Estimated Value
Purchase Details
Closed on
Dec 15, 2005
Sold by
Whitten Jeanne P
Bought by
Gary Richard A
Create a Home Valuation Report for This Property
The Home Valuation Report is an in-depth analysis detailing your home's value as well as a comparison with similar homes in the area
Home Values in the Area
Average Home Value in this Area
Purchase History
| Date | Buyer | Sale Price | Title Company |
|---|---|---|---|
| Dinsmore Frank B | -- | -- | |
| Gary Richard A | -- | -- |
Source: Public Records
Tax History Compared to Growth
Tax History
| Year | Tax Paid | Tax Assessment Tax Assessment Total Assessment is a certain percentage of the fair market value that is determined by local assessors to be the total taxable value of land and additions on the property. | Land | Improvement |
|---|---|---|---|---|
| 2024 | $4,658 | $251,100 | $40,500 | $210,600 |
| 2023 | $4,246 | $221,700 | $38,900 | $182,800 |
| 2022 | $3,986 | $195,400 | $38,900 | $156,500 |
| 2021 | $3,746 | $168,000 | $36,000 | $132,000 |
| 2020 | $3,631 | $156,500 | $34,300 | $122,200 |
| 2019 | $3,494 | $151,900 | $34,300 | $117,600 |
| 2018 | $3,321 | $144,700 | $34,300 | $110,400 |
| 2017 | $3,130 | $138,800 | $34,300 | $104,500 |
| 2016 | $3,062 | $136,100 | $34,300 | $101,800 |
| 2015 | $2,807 | $127,900 | $34,300 | $93,600 |
| 2014 | -- | $124,500 | $34,300 | $90,200 |
| 2013 | $2,590 | $124,500 | $34,300 | $90,200 |
Source: Public Records
Map
Nearby Homes