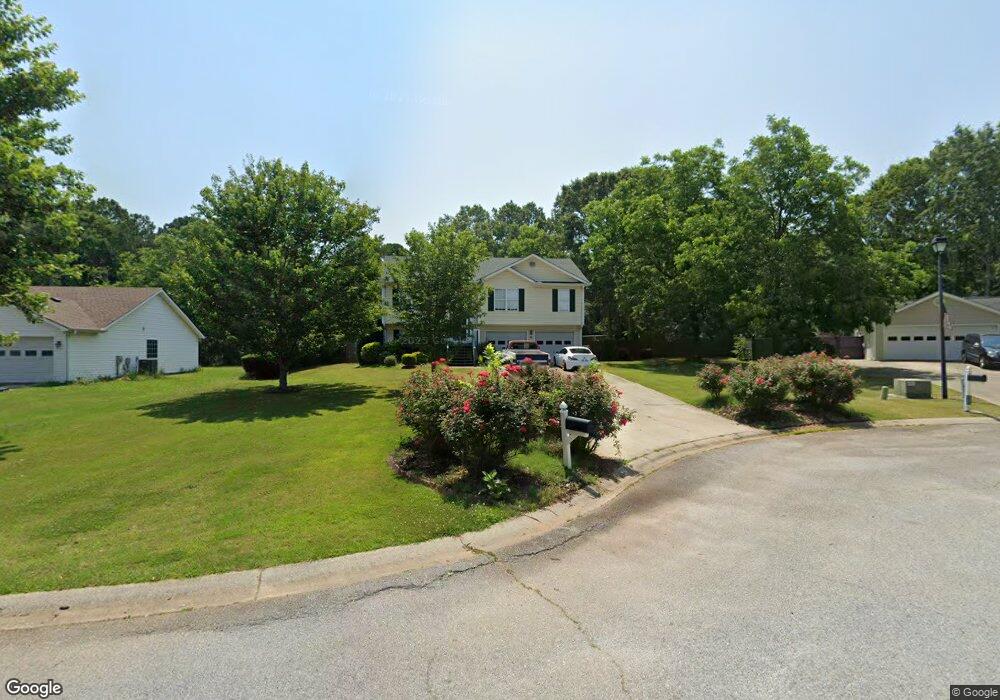
363 Glenmoor Place Unit 1 Winder, GA 30680
Estimated Value: $287,451 - $323,000
--
Bed
2
Baths
1,378
Sq Ft
$224/Sq Ft
Est. Value
About This Home
This home is located at 363 Glenmoor Place Unit 1, Winder, GA 30680 and is currently estimated at $308,863, approximately $224 per square foot. 363 Glenmoor Place Unit 1 is a home located in Barrow County with nearby schools including Kennedy Elementary School, Westside Middle School, and Apalachee High School.
Ownership History
Date
Name
Owned For
Owner Type
Purchase Details
Closed on
May 7, 2020
Sold by
Mondragon Garfias Jaime
Bought by
Mondragon Garfias Jaime and Gunter Hannah Lee
Current Estimated Value
Home Financials for this Owner
Home Financials are based on the most recent Mortgage that was taken out on this home.
Original Mortgage
$196,377
Outstanding Balance
$174,666
Interest Rate
3.5%
Mortgage Type
FHA
Estimated Equity
$134,197
Purchase Details
Closed on
Nov 30, 2001
Sold by
Cabrera Jose
Bought by
Cabrera Jose and Cabrera Virginia
Home Financials for this Owner
Home Financials are based on the most recent Mortgage that was taken out on this home.
Original Mortgage
$116,700
Interest Rate
6.6%
Mortgage Type
New Conventional
Purchase Details
Closed on
Feb 16, 2001
Sold by
Walthoo Development
Bought by
Henry D Jackson Comp
Purchase Details
Closed on
Feb 5, 2001
Bought by
Walthoo Development
Create a Home Valuation Report for This Property
The Home Valuation Report is an in-depth analysis detailing your home's value as well as a comparison with similar homes in the area
Home Values in the Area
Average Home Value in this Area
Purchase History
| Date | Buyer | Sale Price | Title Company |
|---|---|---|---|
| Mondragon Garfias Jaime | -- | -- | |
| Mondragon Garfias Jaime | $200,000 | -- | |
| Cabrera Jose | -- | -- | |
| Cabrera Jose | $122,900 | -- | |
| Henry D Jackson Comp | -- | -- | |
| Walthoo Development | -- | -- |
Source: Public Records
Mortgage History
| Date | Status | Borrower | Loan Amount |
|---|---|---|---|
| Open | Mondragon Garfias Jaime | $196,377 | |
| Closed | Mondragon Garfias Jaime | $196,377 | |
| Previous Owner | Cabrera Jose | $116,700 |
Source: Public Records
Tax History Compared to Growth
Tax History
| Year | Tax Paid | Tax Assessment Tax Assessment Total Assessment is a certain percentage of the fair market value that is determined by local assessors to be the total taxable value of land and additions on the property. | Land | Improvement |
|---|---|---|---|---|
| 2024 | $2,142 | $86,897 | $20,400 | $66,497 |
| 2023 | $1,737 | $87,297 | $20,400 | $66,897 |
| 2022 | $2,357 | $83,358 | $19,400 | $63,958 |
| 2021 | $1,990 | $66,734 | $16,000 | $50,734 |
| 2020 | $1,885 | $66,734 | $16,000 | $50,734 |
| 2019 | $1,650 | $55,431 | $16,000 | $39,431 |
| 2018 | $1,661 | $56,981 | $12,000 | $44,981 |
| 2017 | $1,424 | $48,912 | $12,000 | $36,912 |
| 2016 | $1,300 | $44,863 | $12,000 | $32,863 |
| 2015 | $1,308 | $44,942 | $12,000 | $32,942 |
| 2014 | $1,073 | $36,968 | $6,272 | $30,696 |
| 2013 | -- | $35,480 | $6,272 | $29,208 |
Source: Public Records
Map
Nearby Homes
- 353 Glenmoor Place
- 552 Casey's Crossing
- 152 Scott Dr
- 109 Plantation Rd
- 282 Turtle Creek Dr
- 94 Matthews School Rd
- 321 Turtle Creek Dr
- 281 Hillside Dr
- 1734 Snapping Ct
- 360 Turtle Creek Dr
- 369 Turtle Creek Dr
- 540 Fort St
- 1510 Box Cir
- 533 Terrapin Ln
- 31 Creekwood Rd
- 2051 Massey Ln
- 164 Turtle Creek Dr
- 526 Terrapin Ln
- 365 Glenmoor Place
- 361 Glenmoor Place
- 359 Glenmoor Place
- 369 Glenmoor Place Unit 1
- 356 Glenmoor Place
- 357 Glenmoor Place
- 366 Glenmoor Place
- 371 Glenmoor Place Unit 1
- 355 Glenmoor Place
- 368 Glenmoor Place Unit 1
- 202 Whistleville Ct
- 373 Glenmoor Place Unit 1
- 557 Caseys Crossing
- 370 Glenmoor Place Unit 1
- 559 Caseys Crossing
- 555 Caseys Crossing
- 255 Turnberry Ln
- 204 Whistleville Ct
- 375 Glenmoor Place
- 257 Turnberry Ln