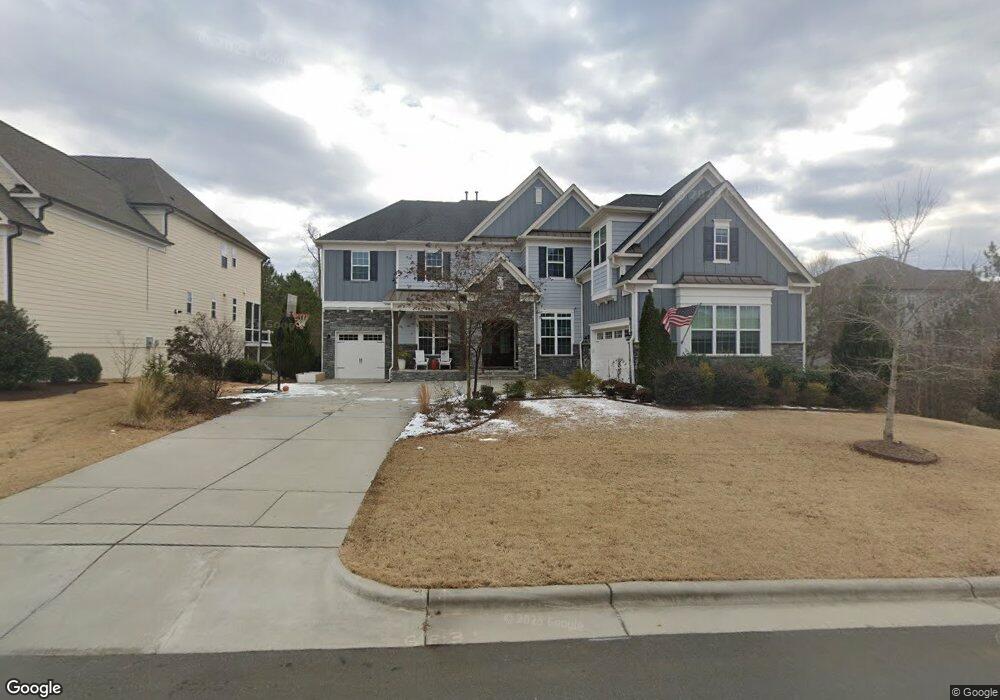
363 Grand Highclere Way Unit Lot 86 Apex, NC 27523
Green Level NeighborhoodEstimated Value: $1,405,000 - $1,625,000
5
Beds
5
Baths
4,536
Sq Ft
$341/Sq Ft
Est. Value
About This Home
This home is located at 363 Grand Highclere Way Unit Lot 86, Apex, NC 27523 and is currently estimated at $1,547,601, approximately $341 per square foot. 363 Grand Highclere Way Unit Lot 86 is a home located in Wake County with nearby schools including White Oak Elementary School, Mills Park Middle School, and Green Level High School.
Ownership History
Date
Name
Owned For
Owner Type
Purchase Details
Closed on
Mar 22, 2022
Sold by
Hinckley and Jamie
Bought by
Sivakumar Mahesh and Vemula Lakshmi Sudheera
Current Estimated Value
Home Financials for this Owner
Home Financials are based on the most recent Mortgage that was taken out on this home.
Original Mortgage
$147,500
Outstanding Balance
$76,924
Interest Rate
3.83%
Estimated Equity
$1,470,677
Purchase Details
Closed on
Mar 23, 2017
Sold by
Stanbard Pacific Of The Carolians Llc
Bought by
Hinckley Richard and Hinckley Jamin
Home Financials for this Owner
Home Financials are based on the most recent Mortgage that was taken out on this home.
Original Mortgage
$622,000
Interest Rate
4.17%
Mortgage Type
New Conventional
Create a Home Valuation Report for This Property
The Home Valuation Report is an in-depth analysis detailing your home's value as well as a comparison with similar homes in the area
Home Values in the Area
Average Home Value in this Area
Purchase History
| Date | Buyer | Sale Price | Title Company |
|---|---|---|---|
| Sivakumar Mahesh | $1,275,000 | Moore & Alphin Pllc | |
| Hinckley Richard | $778,000 | None Available |
Source: Public Records
Mortgage History
| Date | Status | Borrower | Loan Amount |
|---|---|---|---|
| Open | Sivakumar Mahesh | $147,500 | |
| Open | Sivakumar Mahesh | $1,000,000 | |
| Previous Owner | Hinckley Richard | $622,000 |
Source: Public Records
Tax History Compared to Growth
Tax History
| Year | Tax Paid | Tax Assessment Tax Assessment Total Assessment is a certain percentage of the fair market value that is determined by local assessors to be the total taxable value of land and additions on the property. | Land | Improvement |
|---|---|---|---|---|
| 2025 | $12,360 | $1,413,391 | $250,000 | $1,163,391 |
| 2024 | $12,083 | $1,413,391 | $250,000 | $1,163,391 |
| 2023 | $9,655 | $878,282 | $190,000 | $688,282 |
| 2022 | $9,062 | $878,282 | $190,000 | $688,282 |
| 2021 | $8,715 | $878,282 | $190,000 | $688,282 |
| 2020 | $7,128 | $878,282 | $190,000 | $688,282 |
| 2019 | $8,757 | $769,280 | $170,000 | $599,280 |
| 2018 | $7,712 | $719,280 | $170,000 | $549,280 |
| 2017 | $3,129 | $314,500 | $170,000 | $144,500 |
Source: Public Records
Map
Nearby Homes
- 289 Williams Grove Ln Unit Lot 66
- The Idlewild Plan at Williams Grove
- 3277 Shannon Woods Ln Unit Lot 82
- 3281 Shannon Woods Ln Unit Lot 83
- 729 Wimberly Rd
- 10018 Secluded Garden Dr Unit 187
- 10011 Secluded Garden Dr Unit 169
- 10008 Secluded Garden Dr Unit 182
- 10016 Secluded Garden Dr Unit 186
- 7110 Mystic Sea Ln Unit Lot 118
- 7134 Mystic Sea Ln Unit Lot 124
- 8001 Mint Whisper Way Unit Lot 83
- 7122 Mystic Sea Ln Unit Lot 121
- 7133 Mystic Sea Ln Unit Lot 92
- 7989 Mint Whisper Way Unit Lot 86
- 3015 Sandy Sage Way Unit Lot 17
- 6104 Clary Sage Way Unit Lot 107
- 6110 Clary Sage Way Unit Lot 108
- 6103 Clary Sage Way
- 6103 Clary Sage Way Unit Lot 111
- 363 Grand Highclere Way
- 359 Grand Highclere Way Unit Lot 87
- 359 Grand Highclere Way
- 3207 Bellamy Ridge Dr Unit 54
- 364 Grand Highclere Way Unit LOT 85
- 3211 Bellamy Ridge Dr
- 370 Grand Highclere Way Unit LOT 84
- 370 Grand Highclere Way
- 3215 Bellamy Ridge Dr Unit Lot 52
- 338 Grand Highclere Way Unit Lot 88
- 3100 Old Banister St Unit 72
- 3100 Olde Banaster St Unit 72
- 374 Grand Highclere Way
- 374 Grand Highclere Way Unit LOT 83
- 330 Grand Highclere Way Unit Lot 89
- 379 Grand Highclere Way
- 3219 Bellamy Ridge Dr Unit Lot 51
- 378 Grand Highclere Way
- 3218 Bellamy Ridge Dr Unit 61
- 3104 Old Banister St Unit 72