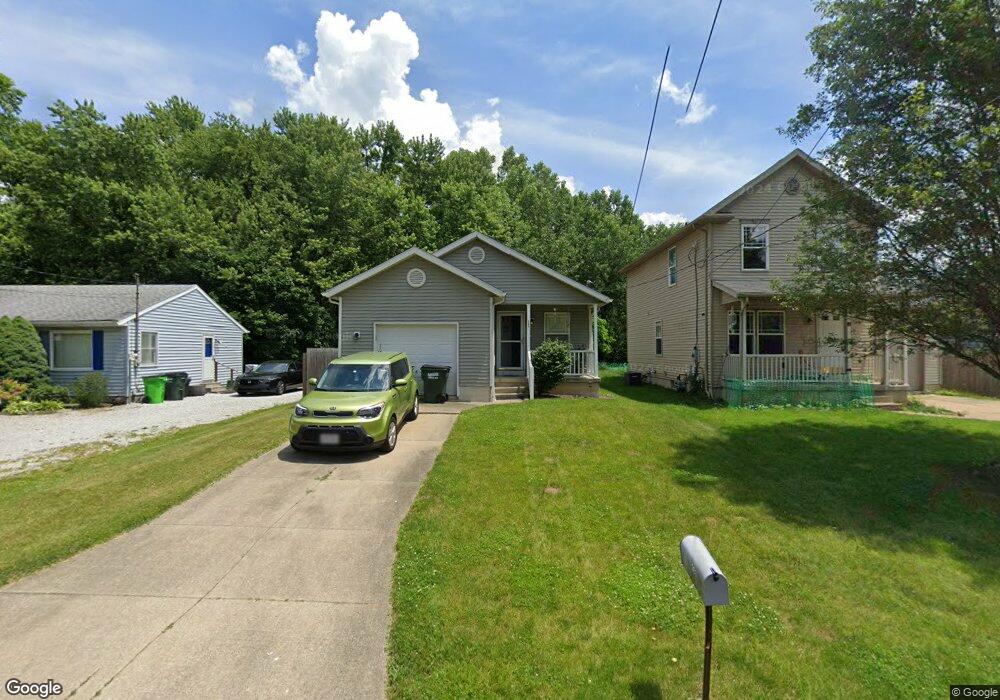
363 Joseph St Barberton, OH 44203
East Barberton NeighborhoodEstimated Value: $143,000 - $207,000
3
Beds
2
Baths
1,172
Sq Ft
$153/Sq Ft
Est. Value
About This Home
This home is located at 363 Joseph St, Barberton, OH 44203 and is currently estimated at $179,708, approximately $153 per square foot. 363 Joseph St is a home located in Summit County with nearby schools including Barberton Middle School, Barberton High School, and St. Francis de Sales School.
Ownership History
Date
Name
Owned For
Owner Type
Purchase Details
Closed on
Jun 12, 2006
Sold by
Evergreen Homes Llc
Bought by
Watson Lindsey Susan
Current Estimated Value
Purchase Details
Closed on
Feb 28, 2005
Sold by
Love Pamela M
Bought by
Evergreen Homes Llc
Purchase Details
Closed on
Nov 20, 1998
Sold by
King Michael A and King Diane M
Bought by
Love Charles and Love Pamela
Create a Home Valuation Report for This Property
The Home Valuation Report is an in-depth analysis detailing your home's value as well as a comparison with similar homes in the area
Home Values in the Area
Average Home Value in this Area
Purchase History
| Date | Buyer | Sale Price | Title Company |
|---|---|---|---|
| Watson Lindsey Susan | $133,000 | First Security Title Corpora | |
| Evergreen Homes Llc | $30,000 | First Security Title Corpora | |
| Love Charles | $3,200 | -- |
Source: Public Records
Mortgage History
| Date | Status | Borrower | Loan Amount |
|---|---|---|---|
| Closed | Watson Lindsey Susan | $0 |
Source: Public Records
Tax History Compared to Growth
Tax History
| Year | Tax Paid | Tax Assessment Tax Assessment Total Assessment is a certain percentage of the fair market value that is determined by local assessors to be the total taxable value of land and additions on the property. | Land | Improvement |
|---|---|---|---|---|
| 2025 | $1,048 | $30,037 | $5,831 | $24,206 |
| 2024 | $1,048 | $30,037 | $5,831 | $24,206 |
| 2023 | $1,048 | $30,037 | $5,831 | $24,206 |
| 2022 | $1,202 | $20,861 | $4,050 | $16,811 |
| 2021 | $1,201 | $20,861 | $4,050 | $16,811 |
| 2020 | $1,175 | $20,860 | $4,050 | $16,810 |
| 2019 | $1,319 | $21,200 | $3,640 | $17,560 |
| 2018 | $1,298 | $21,200 | $3,640 | $17,560 |
| 2017 | $1,199 | $21,200 | $3,640 | $17,560 |
| 2016 | $1,201 | $19,320 | $3,640 | $15,680 |
| 2015 | $1,199 | $19,320 | $3,640 | $15,680 |
| 2014 | $1,192 | $19,320 | $3,640 | $15,680 |
| 2013 | $1,159 | $19,480 | $3,640 | $15,840 |
Source: Public Records
Map
Nearby Homes
- 311 Holly Place
- 251 Slate Ridge Dr
- 588 Austin Dr
- 369 Big Bend Cir
- 375 Big Bend Cir
- 43 S Van Buren Ave
- 25 S Van Buren Ave
- 327 Robinson Ave
- 6 5th St NE
- 477 Robinson Ave
- 414 E Baird Ave
- 1110 Mansion Dr
- 64 Diamond Ave
- 986 S Azalea Blvd
- 1742 Turkeyfoot Lake Rd
- 357 E Paige Ave
- 650 E Tuscarawas Ave
- 349 E Hopocan Ave
- 861 Wisteria Dr
- 344 E Huston St