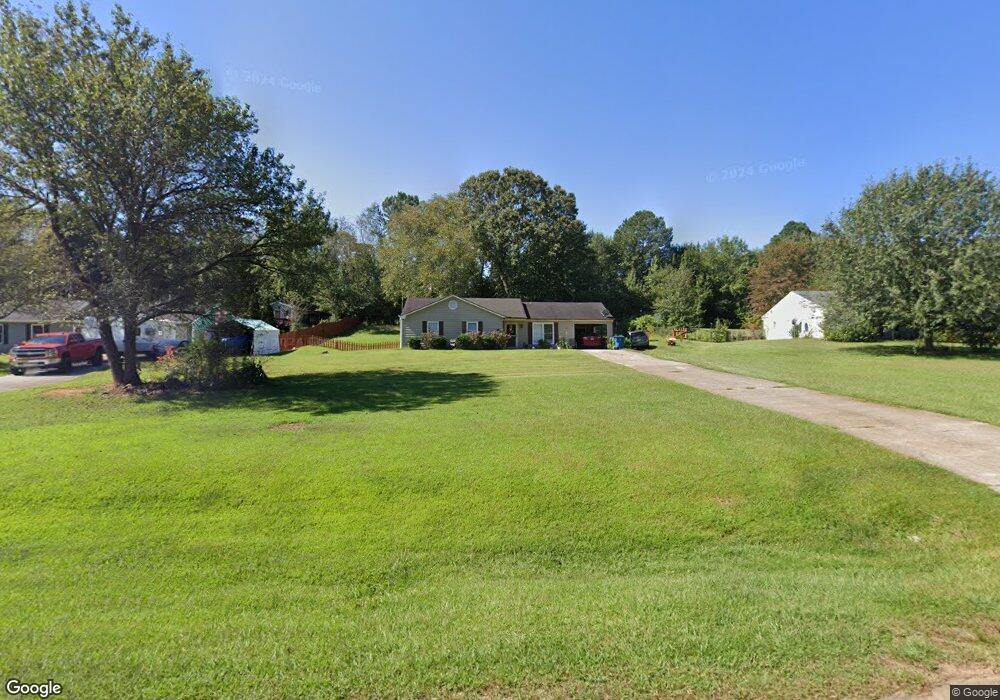
363 Meadow Trace Dr Auburn, GA 30011
Estimated Value: $269,646 - $281,000
3
Beds
2
Baths
1,278
Sq Ft
$216/Sq Ft
Est. Value
About This Home
This home is located at 363 Meadow Trace Dr, Auburn, GA 30011 and is currently estimated at $276,412, approximately $216 per square foot. 363 Meadow Trace Dr is a home located in Barrow County with nearby schools including Auburn Elementary School, Westside Middle School, and Apalachee High School.
Ownership History
Date
Name
Owned For
Owner Type
Purchase Details
Closed on
Jan 15, 2025
Sold by
Salvation Army Youth Fund Living Trust
Bought by
Back Porch Enterprises Llc
Current Estimated Value
Purchase Details
Closed on
Dec 12, 2017
Sold by
Barber Norman S
Bought by
Salvation Army Youth Fund Liv Trust
Purchase Details
Closed on
Oct 15, 2010
Sold by
Hud-Housing Of Urban Dev
Bought by
Barber Norman S
Purchase Details
Closed on
Feb 2, 2010
Sold by
Pnc Bk National Assn
Bought by
Hud-Housing Of Urban Dev
Purchase Details
Closed on
Sep 10, 1999
Sold by
Hud
Bought by
Peacock Ralph L
Home Financials for this Owner
Home Financials are based on the most recent Mortgage that was taken out on this home.
Original Mortgage
$74,155
Interest Rate
7.89%
Mortgage Type
FHA
Purchase Details
Closed on
Oct 6, 1998
Sold by
Chase Manhattan Mtg Corp
Bought by
Secretary
Purchase Details
Closed on
Dec 23, 1996
Sold by
Hud
Bought by
Gissendaner Douglas
Purchase Details
Closed on
Sep 3, 1996
Sold by
Midfirst Bank
Bought by
Secretary Of Housing
Create a Home Valuation Report for This Property
The Home Valuation Report is an in-depth analysis detailing your home's value as well as a comparison with similar homes in the area
Home Values in the Area
Average Home Value in this Area
Purchase History
| Date | Buyer | Sale Price | Title Company |
|---|---|---|---|
| Back Porch Enterprises Llc | -- | -- | |
| Salvation Army Youth Fund Liv Trust | -- | -- | |
| Barber Norman S | -- | -- | |
| Hud-Housing Of Urban Dev | -- | -- | |
| Pnc Bk National Assn | $76,985 | -- | |
| Peacock Ralph L | -- | -- | |
| Secretary | -- | -- | |
| Gissendaner Douglas | -- | -- | |
| Secretary Of Housing | -- | -- |
Source: Public Records
Mortgage History
| Date | Status | Borrower | Loan Amount |
|---|---|---|---|
| Previous Owner | Peacock Ralph L | $74,155 | |
| Closed | Gissendaner Douglas | $0 |
Source: Public Records
Tax History Compared to Growth
Tax History
| Year | Tax Paid | Tax Assessment Tax Assessment Total Assessment is a certain percentage of the fair market value that is determined by local assessors to be the total taxable value of land and additions on the property. | Land | Improvement |
|---|---|---|---|---|
| 2024 | $1,613 | $52,528 | $12,000 | $40,528 |
| 2023 | $1,349 | $52,528 | $12,000 | $40,528 |
| 2022 | $1,192 | $40,327 | $12,000 | $28,327 |
| 2021 | $1,277 | $40,327 | $12,000 | $28,327 |
| 2020 | $1,221 | $38,327 | $10,000 | $28,327 |
| 2019 | $1,240 | $38,327 | $10,000 | $28,327 |
| 2018 | $1,237 | $38,327 | $10,000 | $28,327 |
| 2017 | $172 | $28,764 | $8,000 | $20,764 |
| 2016 | $711 | $22,014 | $5,782 | $16,232 |
| 2015 | $712 | $22,014 | $5,782 | $16,232 |
| 2014 | $690 | $22,014 | $5,782 | $16,232 |
| 2013 | -- | $24,814 | $5,782 | $19,032 |
Source: Public Records
Map
Nearby Homes
- 331 Wages Rd
- 335 Wages Rd
- 1778 Wynfield Ln
- 491 Glen Terrace Rd
- 2057 Blackberry Ln
- 2063 Blackberry Ln
- 270 E Union Grove Cir
- 60 Wood Chuck Ct
- 70 Wood Chuck Ct
- 1923 Westfall Landing
- 494 Courtney Ln Unit 2
- 280 Etheridge Rd
- 539 Hayes Rd
- 81 Hills Shop Rd
- 189 Etheridge Rd
- 345 Etheridge Rd
- 42 Avian Way Unit 128B
- 50 Black Gum Lot 49 Ln Unit 49
- 7 Hydrangea Unit 70 Way
- 361 Meadow Trace Dr
- 365 Meadow Trace Dr
- 359 Meadow Trace Dr
- 367 Meadow Trace Dr
- 362 Meadow Trace Dr
- 364 Meadow Trace Dr
- 360 Meadow Trace Dr
- 369 Meadow Trace Dr
- 357 Meadow Trace Dr
- 366 Meadow Trace Dr
- 358 Meadow Trace Dr
- 0 Meadow Trace Dr Unit 7055611
- 0 Meadow Trace Dr Unit 8466921
- 0 Meadow Trace Dr Unit 8356641
- 0 Meadow Trace Dr Unit 7365605
- 0 Meadow Trace Dr Unit 8490848
- 0 Meadow Trace Dr Unit 3172557
- 368 Meadow Trace Dr
- 371 Meadow Trace Dr
- 355 Meadow Trace Dr