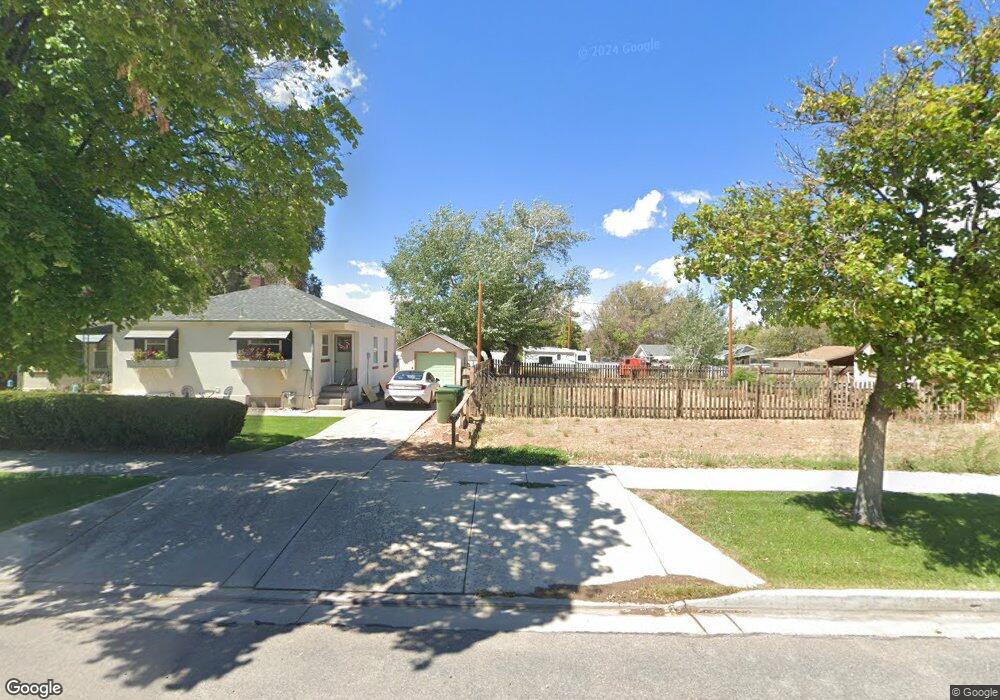
363 N Main St Parowan, UT 84761
Estimated Value: $416,000 - $574,064
5
Beds
2
Baths
2,508
Sq Ft
$199/Sq Ft
Est. Value
About This Home
This home is located at 363 N Main St, Parowan, UT 84761 and is currently estimated at $499,266, approximately $199 per square foot. 363 N Main St is a home located in Iron County with nearby schools including Parowan School, Parowan High School, and Cedar City High School.
Ownership History
Date
Name
Owned For
Owner Type
Purchase Details
Closed on
Mar 29, 2024
Sold by
Askeroth Jess Leslie
Bought by
Jess Askeroth Separate Property Trust and Askeroth
Current Estimated Value
Purchase Details
Closed on
Oct 4, 2021
Sold by
Kenneth Loosley Edward
Bought by
Askeroth Jess Leslie
Create a Home Valuation Report for This Property
The Home Valuation Report is an in-depth analysis detailing your home's value as well as a comparison with similar homes in the area
Home Values in the Area
Average Home Value in this Area
Purchase History
| Date | Buyer | Sale Price | Title Company |
|---|---|---|---|
| Jess Askeroth Separate Property Trust | -- | None Listed On Document | |
| Askeroth Jess Leslie | -- | Security Escrow & Title |
Source: Public Records
Tax History Compared to Growth
Tax History
| Year | Tax Paid | Tax Assessment Tax Assessment Total Assessment is a certain percentage of the fair market value that is determined by local assessors to be the total taxable value of land and additions on the property. | Land | Improvement |
|---|---|---|---|---|
| 2025 | $1,377 | $170,960 | $56,955 | $114,005 |
| 2023 | $1,448 | $171,105 | $56,955 | $114,150 |
| 2022 | $1,407 | $146,900 | $51,775 | $95,125 |
| 2021 | $985 | $102,820 | $32,360 | $70,460 |
| 2020 | $1,022 | $94,285 | $25,395 | $68,890 |
| 2019 | $975 | $85,825 | $25,395 | $60,430 |
| 2018 | $958 | $82,510 | $22,080 | $60,430 |
| 2017 | $888 | $74,655 | $22,080 | $52,575 |
| 2016 | $878 | $69,875 | $22,080 | $47,795 |
| 2015 | $873 | $65,680 | $0 | $0 |
| 2014 | $916 | $65,680 | $0 | $0 |
Source: Public Records
Map
Nearby Homes
- 10 ACFT Water Right: 75-2258 Unit 1917 Priority
- 1 ACFT Water Right: 75-251 Unit 1915 Priority
- 390 N 200 W
- 82 W Pioneer Ave
- 100 W 700 N
- 267 N 300 W
- 219 N 300 E
- 220 N 300 E
- 434 W 300 N
- 60 S 100 W
- 25 S 200 E
- 512 N Diane St
- 60 S 200 E
- 30 N 100 W
- 45 W 100 S
- 161 E 200 South St
- 5 Acres On 400 N
- 65 E 300 St S