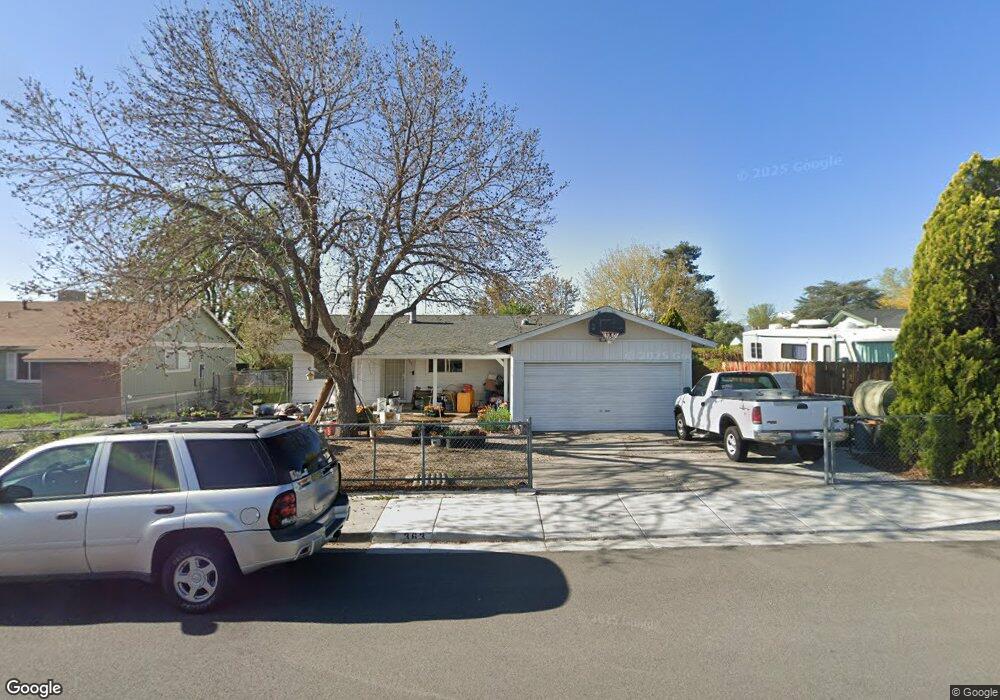
363 Penny Way Sparks, NV 89431
McCarran Boulevard-Probasco NeighborhoodEstimated Value: $359,000 - $441,000
4
Beds
2
Baths
1,346
Sq Ft
$303/Sq Ft
Est. Value
About This Home
This home is located at 363 Penny Way, Sparks, NV 89431 and is currently estimated at $407,964, approximately $303 per square foot. 363 Penny Way is a home located in Washoe County with nearby schools including Hershal H. Beam Elementary School, Lena Juniper Elementary School, and Lou Mendive Middle School.
Ownership History
Date
Name
Owned For
Owner Type
Purchase Details
Closed on
Apr 8, 2011
Sold by
Ramil Ronnie M and Ramil Elizabeth N
Bought by
Kiserow Jack
Current Estimated Value
Purchase Details
Closed on
Jun 12, 2003
Sold by
Velarde Hortencia
Bought by
Ramil Ronnie M and Ramil Elizabeth N
Home Financials for this Owner
Home Financials are based on the most recent Mortgage that was taken out on this home.
Original Mortgage
$157,140
Interest Rate
5.61%
Mortgage Type
Unknown
Purchase Details
Closed on
Sep 9, 2000
Sold by
Velarde Lawrence V and Velarde Hortencia
Bought by
Velarde Hortencia
Purchase Details
Closed on
Jul 17, 1995
Sold by
Chen Kenneth Chuan Che and Chen Iretta Mei Shiu
Bought by
Velarde Lawrence V and Velarde Hortencia
Home Financials for this Owner
Home Financials are based on the most recent Mortgage that was taken out on this home.
Original Mortgage
$108,078
Interest Rate
7.5%
Mortgage Type
FHA
Create a Home Valuation Report for This Property
The Home Valuation Report is an in-depth analysis detailing your home's value as well as a comparison with similar homes in the area
Home Values in the Area
Average Home Value in this Area
Purchase History
| Date | Buyer | Sale Price | Title Company |
|---|---|---|---|
| Kiserow Jack | $95,000 | First Centennial Reno | |
| Ramil Ronnie M | $162,000 | Western Title Incorporated | |
| Velarde Hortencia | -- | Western Title Incorporated | |
| Velarde Hortencia | -- | -- | |
| Velarde Lawrence V | $110,000 | First American Title Co |
Source: Public Records
Mortgage History
| Date | Status | Borrower | Loan Amount |
|---|---|---|---|
| Previous Owner | Ramil Ronnie M | $157,140 | |
| Previous Owner | Velarde Lawrence V | $108,078 |
Source: Public Records
Tax History Compared to Growth
Tax History
| Year | Tax Paid | Tax Assessment Tax Assessment Total Assessment is a certain percentage of the fair market value that is determined by local assessors to be the total taxable value of land and additions on the property. | Land | Improvement |
|---|---|---|---|---|
| 2025 | $1,115 | $57,337 | $36,715 | $20,622 |
| 2024 | $1,115 | $55,064 | $34,755 | $20,309 |
| 2023 | $1,082 | $53,730 | $34,930 | $18,800 |
| 2022 | $1,051 | $43,786 | $28,455 | $15,331 |
| 2021 | $1,021 | $34,582 | $19,635 | $14,947 |
| 2020 | $990 | $32,514 | $17,850 | $14,664 |
| 2019 | $961 | $33,570 | $18,725 | $14,845 |
| 2018 | $933 | $28,587 | $13,545 | $15,042 |
| 2017 | $906 | $27,662 | $12,075 | $15,587 |
| 2016 | $883 | $27,935 | $11,550 | $16,385 |
| 2015 | $881 | $26,250 | $9,415 | $16,835 |
| 2014 | $855 | $24,634 | $7,980 | $16,654 |
| 2013 | -- | $22,863 | $5,985 | $16,878 |
Source: Public Records
Map
Nearby Homes
- 3245 Elaine Way
- 3465 Dawn Cir
- 465 Lenwood Dr
- 3545 4th St
- 780 Emerson Way
- 3607 Keogh Dr
- 119 Devere Way
- 120 E Lenwood Dr
- 3595 Rocky Ridge Ct
- 5650 Wedekind Rd
- 10 Sheridan Way
- 2865 Patrice Dr
- 3071 Meadowlands Dr
- 3252 Holman Way
- 3104 Sandy St
- 3332 Shari Way
- 3269 Valley Forge Way
- 5530 High Rock Way
- 1940 4th St Unit 20
- 1940 4th St Unit 51