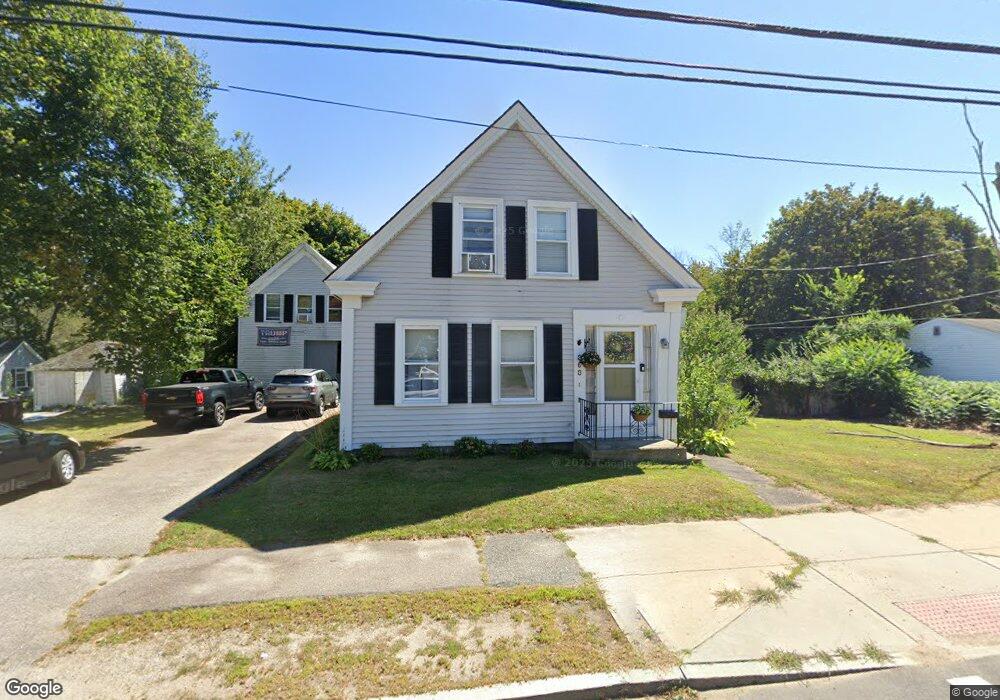
363 Pleasant St South Weymouth, MA 02190
South Weymouth NeighborhoodEstimated Value: $581,000 - $606,000
3
Beds
1
Bath
1,172
Sq Ft
$506/Sq Ft
Est. Value
About This Home
This home is located at 363 Pleasant St, South Weymouth, MA 02190 and is currently estimated at $593,440, approximately $506 per square foot. 363 Pleasant St is a home located in Norfolk County with nearby schools including Ralph Talbot Primary School, Abigail Adams Middle School, and Weymouth Middle School Chapman.
Ownership History
Date
Name
Owned For
Owner Type
Purchase Details
Closed on
Nov 19, 2020
Sold by
Riley John E
Bought by
Riley Sherry
Current Estimated Value
Purchase Details
Closed on
Feb 7, 2013
Sold by
Riley Sherry
Bought by
Riley Sherry and Riley John E
Home Financials for this Owner
Home Financials are based on the most recent Mortgage that was taken out on this home.
Original Mortgage
$265,998
Interest Rate
3.57%
Mortgage Type
Stand Alone Refi Refinance Of Original Loan
Purchase Details
Closed on
Jun 10, 2010
Sold by
Riley John and Riley Sherry
Bought by
Riley Sherry
Purchase Details
Closed on
Sep 28, 1998
Sold by
Stasium Jeffrey M
Bought by
Riley John and Riley Sherry
Purchase Details
Closed on
Oct 7, 1996
Sold by
Lewis John C and Lewis Aletha G
Bought by
Stasium Jeffrey M
Create a Home Valuation Report for This Property
The Home Valuation Report is an in-depth analysis detailing your home's value as well as a comparison with similar homes in the area
Home Values in the Area
Average Home Value in this Area
Purchase History
| Date | Buyer | Sale Price | Title Company |
|---|---|---|---|
| Riley Sherry | -- | None Available | |
| Riley Sherry | -- | -- | |
| Riley Sherry | -- | -- | |
| Riley John | $147,500 | -- | |
| Stasium Jeffrey M | $118,000 | -- |
Source: Public Records
Mortgage History
| Date | Status | Borrower | Loan Amount |
|---|---|---|---|
| Previous Owner | Riley John E | $265,998 | |
| Previous Owner | Stasium Jeffrey M | $278,358 | |
| Previous Owner | Riley John | $25,000 | |
| Previous Owner | Riley John | $248,500 | |
| Previous Owner | Riley John | $245,000 | |
| Previous Owner | Stasium Jeffrey M | $25,000 | |
| Previous Owner | Riley John | $192,500 | |
| Previous Owner | Riley John E | $168,000 | |
| Previous Owner | Riley John | $30,000 | |
| Previous Owner | Stasium Jeffrey M | $134,500 |
Source: Public Records
Tax History Compared to Growth
Tax History
| Year | Tax Paid | Tax Assessment Tax Assessment Total Assessment is a certain percentage of the fair market value that is determined by local assessors to be the total taxable value of land and additions on the property. | Land | Improvement |
|---|---|---|---|---|
| 2025 | $4,558 | $451,300 | $216,200 | $235,100 |
| 2024 | $4,416 | $430,000 | $205,900 | $224,100 |
| 2023 | $4,255 | $407,200 | $190,600 | $216,600 |
| 2022 | $4,170 | $363,900 | $176,500 | $187,400 |
| 2021 | $3,798 | $323,500 | $176,500 | $147,000 |
| 2020 | $3,619 | $303,600 | $176,500 | $127,100 |
| 2019 | $3,534 | $291,600 | $169,700 | $121,900 |
| 2018 | $3,463 | $277,000 | $161,600 | $115,400 |
| 2017 | $3,349 | $261,400 | $154,000 | $107,400 |
| 2016 | $3,238 | $253,000 | $148,000 | $105,000 |
| 2015 | $2,997 | $232,300 | $133,200 | $99,100 |
| 2014 | $3,099 | $233,000 | $137,800 | $95,200 |
Source: Public Records
Map
Nearby Homes
- 120 Burkhall St Unit K
- 261 Pleasant St Unit 5
- 206 Pine St
- 5 Oak St
- 159 Tall Oaks Dr Unit D
- 200 Burkhall St Unit 803
- 121 Tall Oaks Dr Unit Q
- 41 Oak St
- 54 Old Quarry Dr
- 446 Ralph Talbot St
- 11 White St
- 27 Park Ave
- 45 Union St
- 17 Sears Rd
- 685 Main St Unit 3
- 2 Mitchell Ln Unit B
- 32 Weaver Rd
- 15 Christine Terrace
- 30 Alroy Rd
- 299 Union St
- 369 Pleasant St
- 353 Pleasant St
- 370 Pleasant St
- 7 Jordan Dr
- 376 Pleasant St
- 347 Pleasant St
- 339 Pleasant St
- 13 Weyfair Path
- 19 Jordan Dr
- 382 Pleasant St
- 21 Weyfair Path
- 335 Pleasant St
- 386 Pleasant St
- 393 Pleasant St
- 18 Jordan Dr
- 31 Weyfair Path
- 340 Pleasant St
- 340 Pleasant St Unit C
- 340 Pleasant St Unit B
- 329 Pleasant St