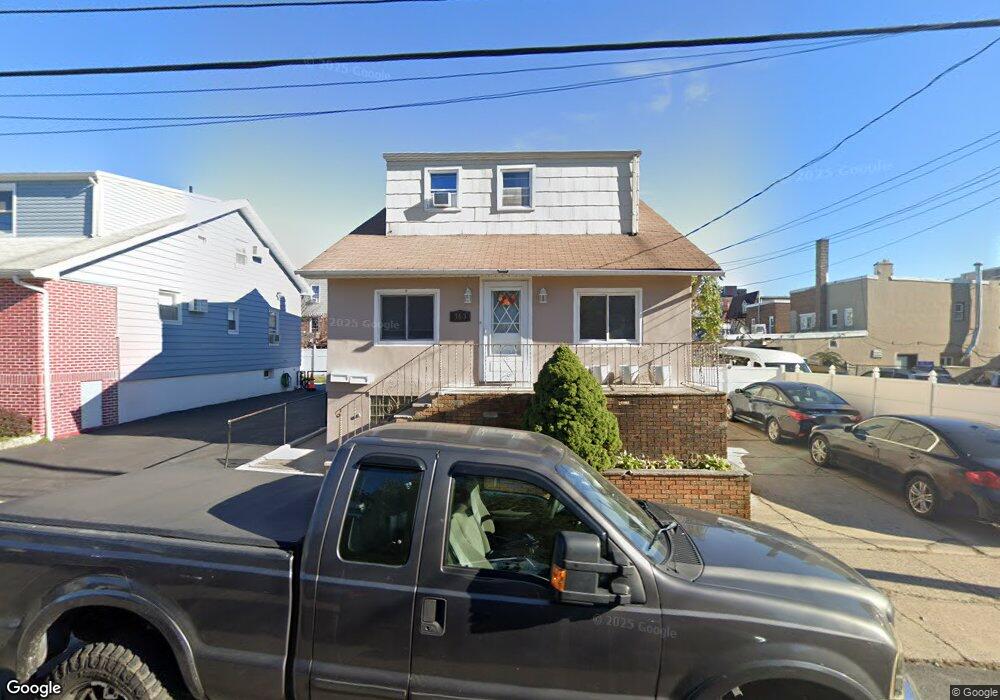
363 Roosevelt St Fairview, NJ 07022
Estimated Value: $621,000 - $729,000
Studio
--
Bath
1,574
Sq Ft
$416/Sq Ft
Est. Value
About This Home
This home is located at 363 Roosevelt St, Fairview, NJ 07022 and is currently estimated at $655,253, approximately $416 per square foot. 363 Roosevelt St is a home located in Bergen County with nearby schools including The Annex Elementary School, Lincoln Elementary School, and Number Three School.
Ownership History
Date
Name
Owned For
Owner Type
Purchase Details
Closed on
Oct 18, 2013
Sold by
Montano Alcides and Montano Ana
Bought by
Montano Ana
Current Estimated Value
Purchase Details
Closed on
Sep 28, 2006
Sold by
Decarvalo Jairo and Carvalho Klebia
Bought by
Montano Alcides
Home Financials for this Owner
Home Financials are based on the most recent Mortgage that was taken out on this home.
Original Mortgage
$440,000
Interest Rate
6.3%
Mortgage Type
New Conventional
Purchase Details
Closed on
Jan 28, 1999
Sold by
Goncalves Maria
Bought by
Decarvalho Jairo
Purchase Details
Closed on
May 16, 1997
Sold by
Constantino Ignazio and Constantino Bruna
Bought by
Decarvalho Jairo De and Goncalves Maria
Home Financials for this Owner
Home Financials are based on the most recent Mortgage that was taken out on this home.
Original Mortgage
$179,000
Interest Rate
8.08%
Mortgage Type
FHA
Create a Home Valuation Report for This Property
The Home Valuation Report is an in-depth analysis detailing your home's value as well as a comparison with similar homes in the area
Home Values in the Area
Average Home Value in this Area
Purchase History
| Date | Buyer | Sale Price | Title Company |
|---|---|---|---|
| Montano Ana | -- | -- | |
| Montano Alcides | $550,000 | -- | |
| Decarvalho Jairo | -- | -- | |
| Decarvalho Jairo De | $183,000 | -- |
Source: Public Records
Mortgage History
| Date | Status | Borrower | Loan Amount |
|---|---|---|---|
| Previous Owner | Montano Alcides | $440,000 | |
| Previous Owner | Decarvalho Jairo De | $179,000 |
Source: Public Records
Tax History
| Year | Tax Paid | Tax Assessment Tax Assessment Total Assessment is a certain percentage of the fair market value that is determined by local assessors to be the total taxable value of land and additions on the property. | Land | Improvement |
|---|---|---|---|---|
| 2025 | $9,483 | $425,100 | $220,300 | $204,800 |
| 2024 | $9,015 | $410,000 | $210,800 | $199,200 |
| 2023 | $8,598 | $398,700 | $206,100 | $192,600 |
| 2022 | $8,598 | $369,800 | $187,100 | $182,700 |
| 2021 | $8,622 | $347,800 | $172,800 | $175,000 |
| 2020 | $8,682 | $335,600 | $168,100 | $167,500 |
| 2019 | $8,645 | $257,600 | $122,500 | $135,100 |
| 2018 | $8,671 | $257,600 | $122,500 | $135,100 |
| 2017 | $8,398 | $257,600 | $122,500 | $135,100 |
| 2016 | $7,937 | $257,600 | $122,500 | $135,100 |
| 2015 | $7,519 | $257,600 | $122,500 | $135,100 |
| 2014 | $7,352 | $257,600 | $122,500 | $135,100 |
Source: Public Records
Map
Nearby Homes
- 385A Roosevelt St
- 373 Mckinley St
- 220 5th St
- 233 5th St Unit B
- 131 Shaler Ave
- 269 Delano Place
- 234 6th St
- 320 Anderson Ave Unit 1B
- 220-222 8th St
- 411 Sheridan Place
- 423 Walker St Unit B5
- 309 2nd St
- 398 Cliff St
- 437 Walker St
- 88 Shaler Ave
- 305 8th St Unit 2
- 305 8th St
- 447 Fairview Ave Unit 304
- 373 Jersey Ave
- 439 Cliff St
- 365 Roosevelt St
- 165 Anderson Ave
- 362 Delano Place
- 364 Delano Place
- 367 Roosevelt St
- 366 Delano Place
- 169 Anderson Ave
- 368 Delano Place
- 370 Delano Place
- 369 Roosevelt St
- 358 Roosevelt St
- 360 Roosevelt St
- 372 Delano Place
- 362 Roosevelt St
- 153 Anderson Ave
- 364 Roosevelt St
- 371 Roosevelt St
- 374 Delano Place
- 368 Roosevelt St
- 376 Delano Place
Your Personal Tour Guide
Ask me questions while you tour the home.