Estimated Value: $640,946 - $802,000
Studio
1
Bath
2,622
Sq Ft
$278/Sq Ft
Est. Value
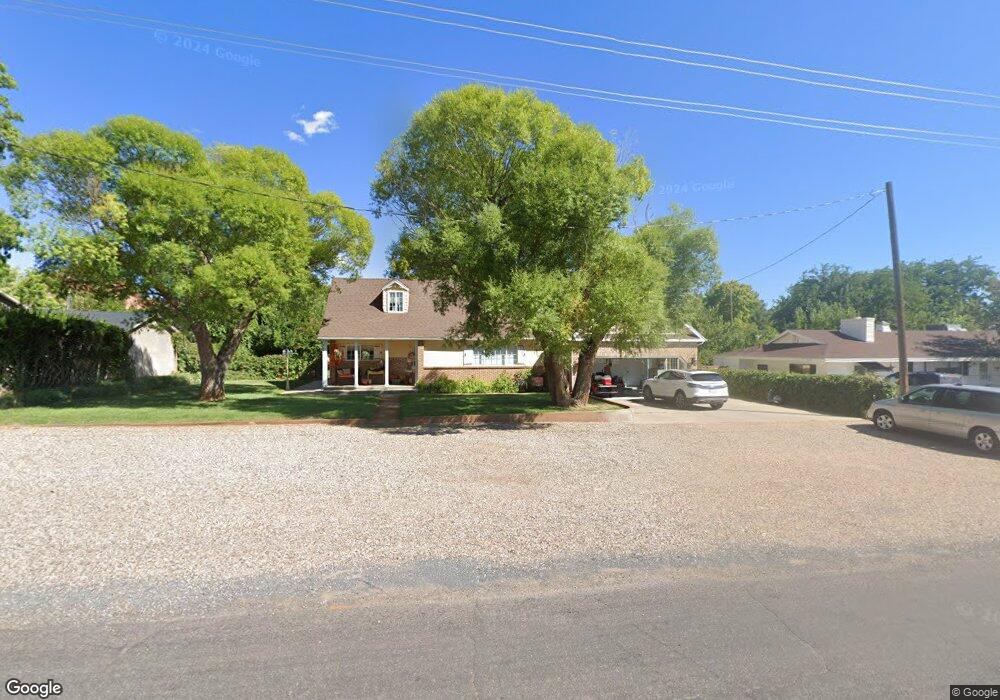
About This Home
This home is located at 363 S 100 W, Kanab, UT 84741 and is currently estimated at $727,737, approximately $277 per square foot. 363 S 100 W is a home located in Kane County with nearby schools including Kanab Elementary School, Kanab Middle School, and Kanab High School.
Ownership History
Date
Name
Owned For
Owner Type
Purchase Details
Closed on
Jun 17, 2013
Sold by
Honey Terril M and Honey Susan L
Bought by
Honey Susan
Current Estimated Value
Purchase Details
Closed on
Jun 10, 2011
Sold by
Mers
Bought by
Mountain America Federal Credit Union
Purchase Details
Closed on
Dec 9, 2008
Sold by
Honey Terril M and Honey Susan L
Bought by
Honey Terril M and Honey Susan L
Home Financials for this Owner
Home Financials are based on the most recent Mortgage that was taken out on this home.
Original Mortgage
$150,000
Interest Rate
6.04%
Purchase Details
Closed on
Dec 8, 2008
Sold by
Honey Terril M and Honey Susan L
Bought by
Honey Terril M and Honey Susan L
Home Financials for this Owner
Home Financials are based on the most recent Mortgage that was taken out on this home.
Original Mortgage
$150,000
Interest Rate
6.04%
Purchase Details
Closed on
May 26, 2005
Sold by
Honey Terril M and Honey Susan L
Bought by
Honey Terril M and Honey Susan L
Create a Home Valuation Report for This Property
The Home Valuation Report is an in-depth analysis detailing your home's value as well as a comparison with similar homes in the area
Home Values in the Area
Average Home Value in this Area
Purchase History
| Date | Buyer | Sale Price | Title Company |
|---|---|---|---|
| Honey Susan | -- | -- | |
| Mountain America Federal Credit Union | -- | -- | |
| Honey Terril M | -- | -- | |
| Honey Terril M | -- | -- | |
| Honey Terril M | -- | -- |
Source: Public Records
Mortgage History
| Date | Status | Borrower | Loan Amount |
|---|---|---|---|
| Previous Owner | Honey Terril M | $150,000 |
Source: Public Records
Tax History
| Year | Tax Paid | Tax Assessment Tax Assessment Total Assessment is a certain percentage of the fair market value that is determined by local assessors to be the total taxable value of land and additions on the property. | Land | Improvement |
|---|---|---|---|---|
| 2025 | $3,031 | $642,451 | $135,168 | $507,283 |
| 2024 | $3,128 | $363,553 | $64,952 | $298,601 |
| 2023 | $2,799 | $333,313 | $61,858 | $271,455 |
| 2022 | $2,496 | $294,360 | $47,583 | $246,777 |
| 2021 | $2,255 | $398,910 | $66,550 | $332,360 |
| 2020 | $2,188 | $375,909 | $60,500 | $315,409 |
| 2019 | $2,154 | $360,297 | $53,988 | $306,309 |
| 2018 | $2,118 | $351,299 | $44,990 | $306,309 |
| 2017 | $2,019 | $319,780 | $40,900 | $278,880 |
| 2016 | $1,776 | $273,049 | $40,900 | $232,149 |
| 2015 | $1,639 | $252,504 | $40,900 | $211,604 |
| 2014 | $1,639 | $250,702 | $43,026 | $207,676 |
| 2013 | -- | $137,886 | $0 | $0 |
Source: Public Records
Map
Nearby Homes
- 325 S Main St
- 476 S 100 E
- 141 W 100 S
- 176 S 100 E
- 235 W 100 S
- 80 E Red Shadow Cir
- 2550 S
- 611 S 175 E
- 425 W Momori Cir Unit A-6
- 425 W Momori Cir Unit B2
- 425 W Momori Cir Unit B1
- 425 W Momori Cir Unit A-5
- 425 Momori Unit B1
- 355 S Tala Cir
- 2660 S Antelope Canyon Bldg 9 Unit 1
- 818 S Highway 89a
- 35 N 100 W
- 70 N Main St
- 1117 S Terrel Dr
- 275 E 650 S Unit 5
Your Personal Tour Guide
Ask me questions while you tour the home.