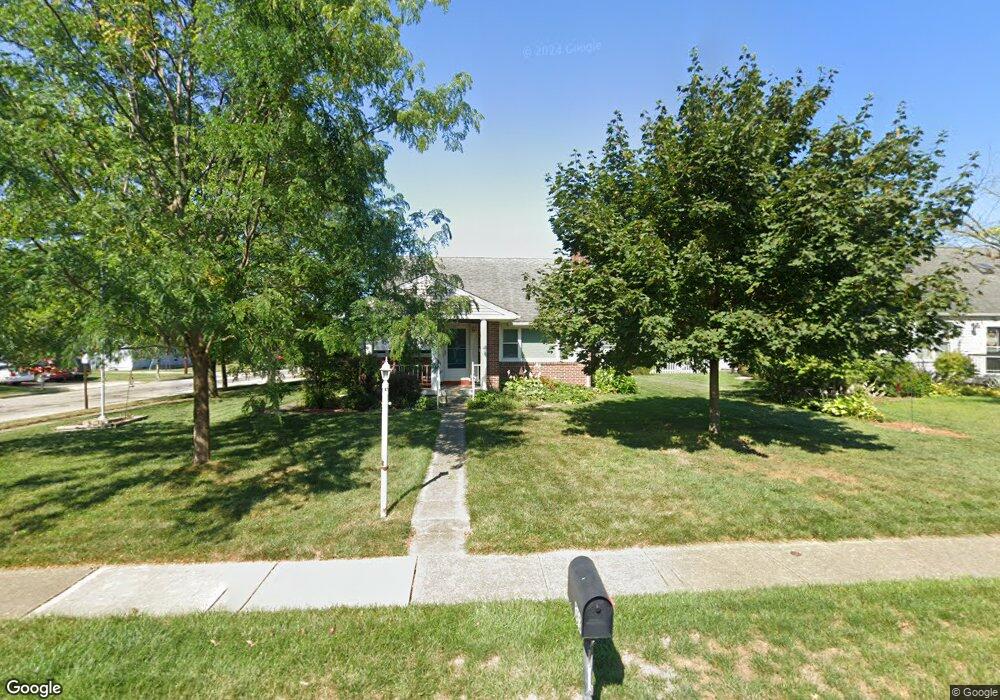
363 Tallman St Groveport, OH 43125
Estimated Value: $272,000 - $318,000
3
Beds
3
Baths
1,559
Sq Ft
$187/Sq Ft
Est. Value
About This Home
This home is located at 363 Tallman St, Groveport, OH 43125 and is currently estimated at $292,029, approximately $187 per square foot. 363 Tallman St is a home located in Franklin County with nearby schools including Groveport Madison High School, Groveport Community School, and Madison Christian School.
Ownership History
Date
Name
Owned For
Owner Type
Purchase Details
Closed on
Apr 16, 2004
Sold by
Tipple Terry W and Tipple Janet L
Bought by
Tipple Terry W and Tipple Janet L
Current Estimated Value
Home Financials for this Owner
Home Financials are based on the most recent Mortgage that was taken out on this home.
Original Mortgage
$120,000
Interest Rate
5.48%
Mortgage Type
New Conventional
Purchase Details
Closed on
Aug 23, 2002
Sold by
Brigner Marvin L and Brigner Marilyn J
Bought by
Tipple Terry W
Purchase Details
Closed on
Aug 7, 1997
Sold by
Lerch Ruth E
Bought by
Brigner Marvin L and Brigner Marilyn J
Home Financials for this Owner
Home Financials are based on the most recent Mortgage that was taken out on this home.
Original Mortgage
$42,500
Interest Rate
7.62%
Create a Home Valuation Report for This Property
The Home Valuation Report is an in-depth analysis detailing your home's value as well as a comparison with similar homes in the area
Home Values in the Area
Average Home Value in this Area
Purchase History
| Date | Buyer | Sale Price | Title Company |
|---|---|---|---|
| Tipple Terry W | -- | Advantage One | |
| Tipple Terry W | $146,900 | -- | |
| Brigner Marvin L | $122,500 | Chicago Title |
Source: Public Records
Mortgage History
| Date | Status | Borrower | Loan Amount |
|---|---|---|---|
| Closed | Tipple Terry W | $120,000 | |
| Previous Owner | Brigner Marvin L | $42,500 |
Source: Public Records
Tax History Compared to Growth
Tax History
| Year | Tax Paid | Tax Assessment Tax Assessment Total Assessment is a certain percentage of the fair market value that is determined by local assessors to be the total taxable value of land and additions on the property. | Land | Improvement |
|---|---|---|---|---|
| 2024 | $4,271 | $87,330 | $27,620 | $59,710 |
| 2023 | $4,233 | $87,325 | $27,615 | $59,710 |
| 2022 | $3,456 | $56,880 | $12,360 | $44,520 |
| 2021 | $3,469 | $56,880 | $12,360 | $44,520 |
| 2020 | $3,477 | $56,880 | $12,360 | $44,520 |
| 2019 | $3,267 | $47,110 | $10,290 | $36,820 |
| 2018 | $3,334 | $47,110 | $10,290 | $36,820 |
| 2017 | $3,292 | $47,110 | $10,290 | $36,820 |
| 2016 | $3,354 | $43,580 | $8,960 | $34,620 |
| 2015 | $3,383 | $43,580 | $8,960 | $34,620 |
| 2014 | $3,185 | $43,580 | $8,960 | $34,620 |
| 2013 | $1,429 | $45,850 | $9,415 | $36,435 |
Source: Public Records
Map
Nearby Homes