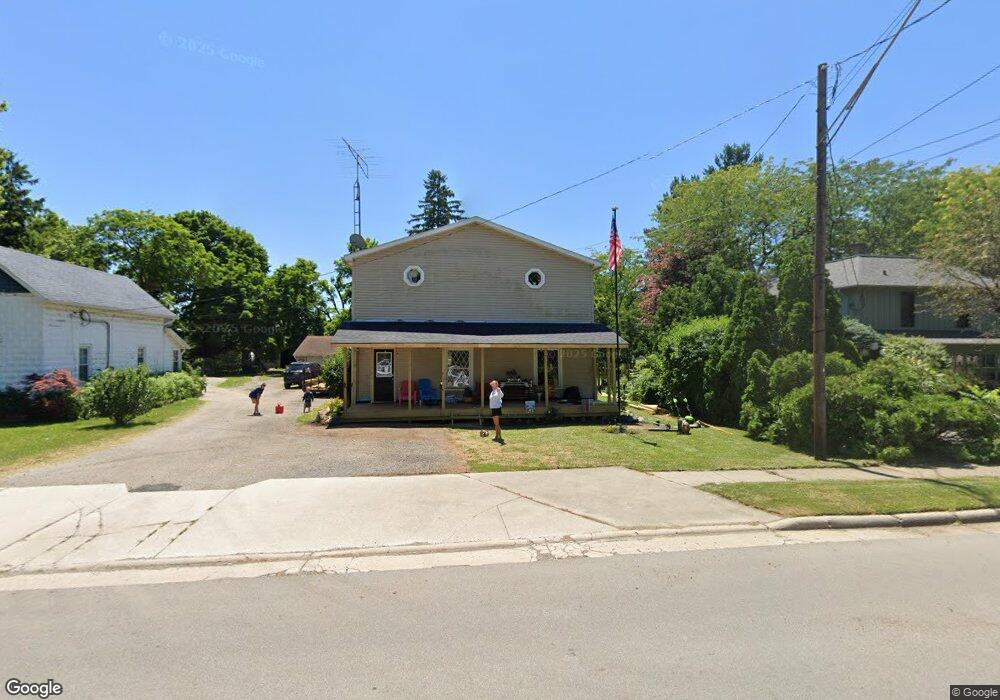
363 W Main St Metamora, OH 43540
Estimated Value: $102,000 - $189,000
5
Beds
2
Baths
2,608
Sq Ft
$61/Sq Ft
Est. Value
About This Home
This home is located at 363 W Main St, Metamora, OH 43540 and is currently estimated at $159,116, approximately $61 per square foot. 363 W Main St is a home located in Fulton County with nearby schools including Evergreen Elementary School, Evergreen Middle School, and Evergreen High School.
Ownership History
Date
Name
Owned For
Owner Type
Purchase Details
Closed on
Jan 11, 2009
Sold by
Deutsche Bank National Trust Company
Bought by
Sayers Robert D
Current Estimated Value
Home Financials for this Owner
Home Financials are based on the most recent Mortgage that was taken out on this home.
Original Mortgage
$52,530
Interest Rate
5.2%
Mortgage Type
FHA
Purchase Details
Closed on
Nov 3, 2008
Sold by
Herrick Heather E and Case #08Cv000102
Bought by
Deutsche Bank National Trust Company
Purchase Details
Closed on
Jul 6, 2005
Sold by
Herrick Scott A and Herrick Heather E
Bought by
Herrick Scott A and Herrick Heather E
Purchase Details
Closed on
Jun 16, 1999
Sold by
Knierim Theresa F
Bought by
Thrall Barbara A
Home Financials for this Owner
Home Financials are based on the most recent Mortgage that was taken out on this home.
Original Mortgage
$47,730
Interest Rate
7.06%
Mortgage Type
New Conventional
Purchase Details
Closed on
Jan 1, 1990
Bought by
Knierim Theresa F
Create a Home Valuation Report for This Property
The Home Valuation Report is an in-depth analysis detailing your home's value as well as a comparison with similar homes in the area
Home Values in the Area
Average Home Value in this Area
Purchase History
| Date | Buyer | Sale Price | Title Company |
|---|---|---|---|
| Sayers Robert D | $53,500 | Attorney | |
| Deutsche Bank National Trust Company | $53,334 | None Available | |
| Herrick Scott A | -- | -- | |
| Thrall Barbara A | $53,036 | -- | |
| Knierim Theresa F | -- | -- |
Source: Public Records
Mortgage History
| Date | Status | Borrower | Loan Amount |
|---|---|---|---|
| Previous Owner | Sayers Robert D | $52,530 | |
| Previous Owner | Thrall Barbara A | $47,730 |
Source: Public Records
Tax History Compared to Growth
Tax History
| Year | Tax Paid | Tax Assessment Tax Assessment Total Assessment is a certain percentage of the fair market value that is determined by local assessors to be the total taxable value of land and additions on the property. | Land | Improvement |
|---|---|---|---|---|
| 2024 | $1,619 | $43,970 | $4,800 | $39,170 |
| 2023 | $1,624 | $43,970 | $4,800 | $39,170 |
| 2022 | $1,604 | $35,320 | $3,990 | $31,330 |
| 2021 | $1,572 | $35,320 | $3,990 | $31,330 |
| 2020 | $1,554 | $35,320 | $3,990 | $31,330 |
| 2019 | $1,415 | $32,660 | $3,990 | $28,670 |
| 2018 | $1,301 | $32,660 | $3,990 | $28,670 |
| 2017 | $1,285 | $32,660 | $3,990 | $28,670 |
| 2016 | $1,235 | $28,840 | $3,990 | $24,850 |
| 2015 | $1,159 | $28,840 | $3,990 | $24,850 |
| 2014 | $1,166 | $28,840 | $3,990 | $24,850 |
| 2013 | $1,648 | $38,220 | $3,780 | $34,440 |
Source: Public Records
Map
Nearby Homes
- 14580 County Road 2
- 2674 US Highway 20
- 13614 Hodges Hwy
- 13490 State Route 64
- 5120 US Highway 20
- 5905 Ohio St
- 13001 Central Ave
- 11883 Sylvania-Metamora Rd
- 1400 N Fulton Lucas Rd
- 1102 N Fulton Lucas Rd
- 6803 County Rd N
- 8667 Thompson Hwy
- 10904 Sylvania Metamora Rd
- 2716 County Road L
- 3893 County Road L
- 11057 Arnold Hwy
- 7 359 County Road Rd W
- 10000 Mason Rd
- 13748 Yankee Rd
- 7127 Scott Hwy