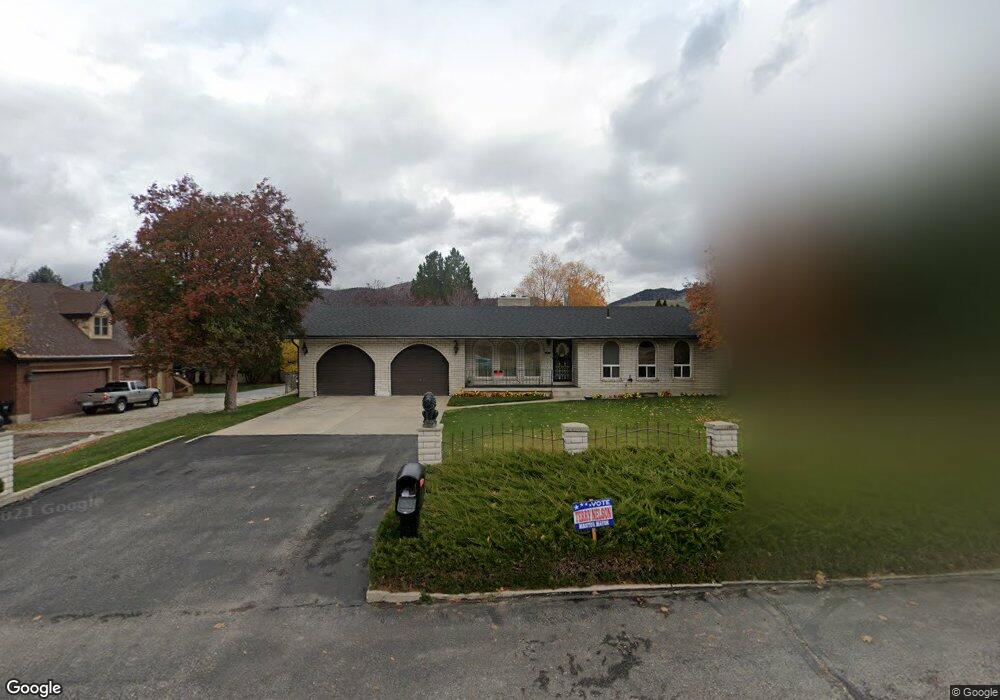
363 Willard Peak Rd Mantua, UT 84324
Estimated Value: $493,000 - $956,000
--
Bed
--
Bath
1,160
Sq Ft
$588/Sq Ft
Est. Value
About This Home
This home is located at 363 Willard Peak Rd, Mantua, UT 84324 and is currently estimated at $682,154, approximately $588 per square foot. 363 Willard Peak Rd is a home located in Box Elder County with nearby schools including Golden Spike Elementary, Box Elder Middle School, and Adele C. Young Intermediate School.
Create a Home Valuation Report for This Property
The Home Valuation Report is an in-depth analysis detailing your home's value as well as a comparison with similar homes in the area
Home Values in the Area
Average Home Value in this Area
Tax History Compared to Growth
Tax History
| Year | Tax Paid | Tax Assessment Tax Assessment Total Assessment is a certain percentage of the fair market value that is determined by local assessors to be the total taxable value of land and additions on the property. | Land | Improvement |
|---|---|---|---|---|
| 2025 | $3,298 | $552,147 | $180,000 | $372,147 |
| 2024 | $2,918 | $544,834 | $175,000 | $369,834 |
| 2023 | $3,077 | $591,110 | $175,000 | $416,110 |
| 2022 | $3,029 | $288,493 | $49,500 | $238,993 |
| 2021 | $2,477 | $347,310 | $90,000 | $257,310 |
| 2020 | $2,417 | $347,310 | $90,000 | $257,310 |
| 2019 | $2,297 | $174,739 | $49,500 | $125,239 |
| 2018 | $1,823 | $131,327 | $44,000 | $87,327 |
| 2017 | $1,877 | $238,777 | $44,000 | $158,777 |
| 2016 | $2,094 | $142,453 | $27,500 | $114,953 |
| 2015 | $1,932 | $133,349 | $27,500 | $105,849 |
| 2014 | $1,932 | $129,013 | $27,500 | $101,513 |
| 2013 | -- | $114,212 | $16,500 | $97,712 |
Source: Public Records
Map
Nearby Homes
- 270 E Mountain View Dr Unit 59
- 655 Willard Peak Rd
- 159 E 625 S
- 115 S Main St
- 1623 Willard Peak Rd Unit 1
- 1705 Willard Peak Rd Unit 2
- 263 E Fish Hatchery Rd
- 534 E Fish Hatchery Rd
- 91 U S 89
- 1329 E Kaylynne Cir
- 64 N Bywater Way
- 637 E 950 S Unit 20
- 192 N Highland Blvd
- 770 E 350 S
- 1066 Beecher Ave
- 1048 Elm Ave
- 165 E 1550 S
- 770 S 400 E Unit 50
- 1102 Carolyn Place
- 510 Aspen Dr
- 371 Willard Peak Rd
- 349 Willard Peak Rd
- 341 Willard Peak Rd
- 405 Willard Peak Rd
- 386 S 100 E Unit 5
- 386 S 100 E
- 368 S 100 E
- 329 Willard Peak Rd
- 330 S 100 E
- 611 Willard Peak Rd
- 417 Willard Peak Rd
- 320 S 100 E
- 412 S 100 E
- 319 Willard Peak Rd
- 373 S 100 E
- 387 S 100 E Unit 1
- 618 E Fish Hatchery Rd
- 553 S Lake View Dr
- 618 E Fish Hatchery Rd Unit 83
- 617 S Lake View Dr