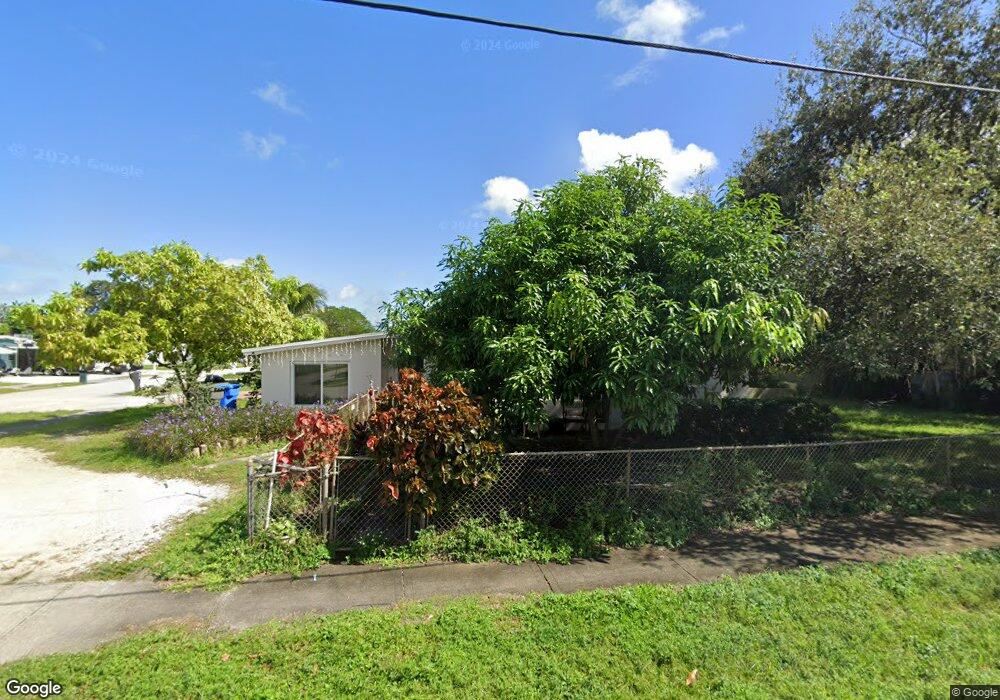
3630 SW 40th St West Park, FL 33023
Lake Forest NeighborhoodEstimated Value: $398,663 - $451,000
2
Beds
1
Bath
1,068
Sq Ft
$390/Sq Ft
Est. Value
About This Home
This home is located at 3630 SW 40th St, West Park, FL 33023 and is currently estimated at $416,166, approximately $389 per square foot. 3630 SW 40th St is a home located in Broward County with nearby schools including Lake Forest Elementary School, McNicol Middle School, and Hallandale High School.
Ownership History
Date
Name
Owned For
Owner Type
Purchase Details
Closed on
Sep 21, 2015
Sold by
Nanan Robert Annette
Bought by
Nanan Robert Marila Isabel Miro Annette
Current Estimated Value
Purchase Details
Closed on
Aug 3, 2004
Sold by
Robert Annette
Bought by
Robert Christopher and Robert Annette
Home Financials for this Owner
Home Financials are based on the most recent Mortgage that was taken out on this home.
Original Mortgage
$128,000
Interest Rate
7.7%
Mortgage Type
New Conventional
Purchase Details
Closed on
Mar 24, 1995
Sold by
Michaud Michael R and Michaud Myra J
Bought by
Young Annette
Home Financials for this Owner
Home Financials are based on the most recent Mortgage that was taken out on this home.
Original Mortgage
$61,145
Interest Rate
8.7%
Mortgage Type
FHA
Purchase Details
Closed on
May 1, 1984
Sold by
Available Not
Bought by
Available Not
Create a Home Valuation Report for This Property
The Home Valuation Report is an in-depth analysis detailing your home's value as well as a comparison with similar homes in the area
Home Values in the Area
Average Home Value in this Area
Purchase History
| Date | Buyer | Sale Price | Title Company |
|---|---|---|---|
| Nanan Robert Marila Isabel Miro Annette | $56,600 | None Available | |
| Robert Christopher | -- | National Legal Services Titl | |
| Young Annette | $60,000 | -- | |
| Available Not | $16,364 | -- |
Source: Public Records
Mortgage History
| Date | Status | Borrower | Loan Amount |
|---|---|---|---|
| Previous Owner | Robert Christopher | $128,000 | |
| Previous Owner | Young Annette | $61,145 |
Source: Public Records
Tax History Compared to Growth
Tax History
| Year | Tax Paid | Tax Assessment Tax Assessment Total Assessment is a certain percentage of the fair market value that is determined by local assessors to be the total taxable value of land and additions on the property. | Land | Improvement |
|---|---|---|---|---|
| 2025 | $9,709 | $326,120 | -- | -- |
| 2024 | $8,828 | $326,120 | $26,400 | $243,130 |
| 2023 | $8,828 | $269,530 | $26,400 | $243,130 |
| 2022 | $1,529 | $59,060 | $0 | $0 |
| 2021 | $1,510 | $57,340 | $0 | $0 |
| 2020 | $1,507 | $56,550 | $0 | $0 |
| 2019 | $1,521 | $55,280 | $0 | $0 |
| 2018 | $3,703 | $54,250 | $0 | $0 |
| 2017 | $3,671 | $53,140 | $0 | $0 |
| 2016 | $1,340 | $52,050 | $0 | $0 |
| 2015 | $1,349 | $51,690 | $0 | $0 |
| 2014 | $1,370 | $51,280 | $0 | $0 |
| 2013 | -- | $52,820 | $11,730 | $41,090 |
Source: Public Records
Map
Nearby Homes
- 3371 SW 37th St
- 21200 NE 12th Ct
- 3800 SW 31st Dr
- 1131 NE 211th Terrace
- 221 W Lake Dr
- 3610 SW 36th St
- 1131 NE 211th St
- 1330 NE 212th Terrace
- 191 W Lake Dr Unit 191
- 1280 NE 211th Terrace
- 3800 SW 41st Ave
- 3611 SW 36th St
- 1271 NE 211th St
- 3720 SW 32nd Ave
- 3311 SW 36th Ct
- 4101 SW 32nd Dr
- 21240 NE 9th Ct Unit 1
- 3411 SW 36th St
- 1300 NE 210th Terrace
- 21021 NE 13th Place
- 3700 SW 40th St
- 3610 SW 40th St
- 3631 SW 40th St
- 3621 SW 40th St
- 3701 SW 41st St
- 3708 SW 40th St
- 3600 SW 40th St
- 3701 SW 40th St
- 3611 SW 40th St
- 3709 SW 41st St
- 3601 SW 41st St
- 3709 SW 40th St
- 3601 SW 40th St
- 3716 SW 40th St
- 3530 SW 40th St
- 3630 SW 39th St
- 3620 SW 39th St
- 3717 SW 41st St
- 3531 SW 41st St
- 3700 SW 39th St