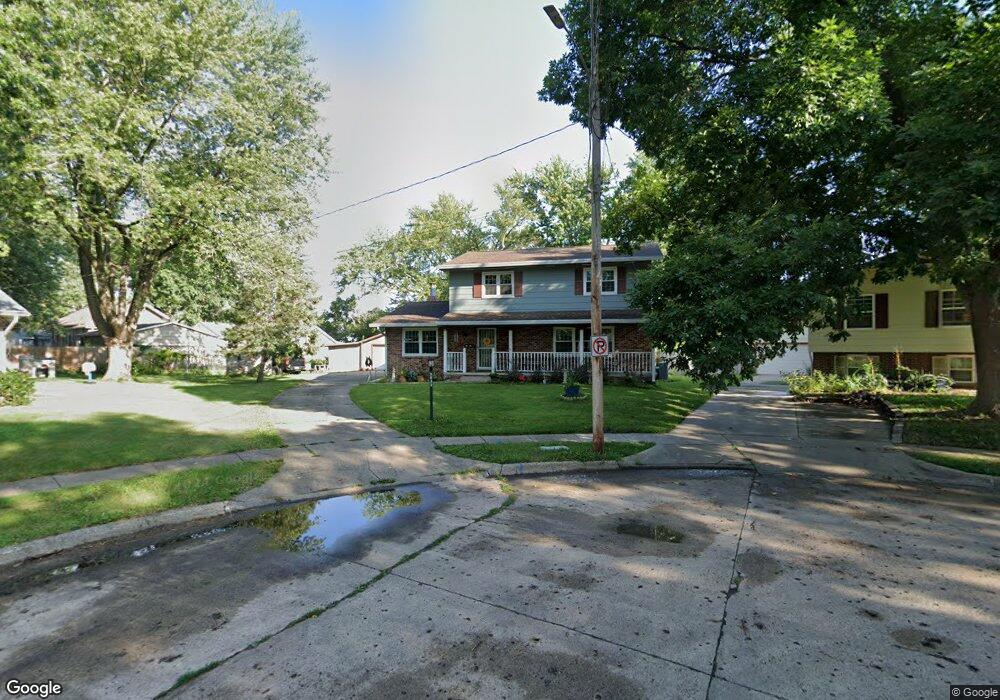
3632 48th Place Des Moines, IA 50310
Beaverdale NeighborhoodEstimated Value: $326,000 - $350,000
4
Beds
3
Baths
1,888
Sq Ft
$179/Sq Ft
Est. Value
About This Home
This home is located at 3632 48th Place, Des Moines, IA 50310 and is currently estimated at $338,724, approximately $179 per square foot. 3632 48th Place is a home located in Polk County with nearby schools including Moore Elementary School, Meredith Middle School, and Hoover High School.
Ownership History
Date
Name
Owned For
Owner Type
Purchase Details
Closed on
Oct 30, 2001
Sold by
Grothe Walter L and Grothe Gladys N
Bought by
Christensen Charles D and Christensen Debbra L
Current Estimated Value
Home Financials for this Owner
Home Financials are based on the most recent Mortgage that was taken out on this home.
Original Mortgage
$125,000
Outstanding Balance
$48,608
Interest Rate
6.8%
Estimated Equity
$290,116
Create a Home Valuation Report for This Property
The Home Valuation Report is an in-depth analysis detailing your home's value as well as a comparison with similar homes in the area
Home Values in the Area
Average Home Value in this Area
Purchase History
| Date | Buyer | Sale Price | Title Company |
|---|---|---|---|
| Christensen Charles D | $139,500 | -- |
Source: Public Records
Mortgage History
| Date | Status | Borrower | Loan Amount |
|---|---|---|---|
| Open | Christensen Charles D | $125,000 |
Source: Public Records
Tax History
| Year | Tax Paid | Tax Assessment Tax Assessment Total Assessment is a certain percentage of the fair market value that is determined by local assessors to be the total taxable value of land and additions on the property. | Land | Improvement |
|---|---|---|---|---|
| 2025 | $6,132 | $357,500 | $61,700 | $295,800 |
| 2024 | $6,132 | $322,200 | $54,700 | $267,500 |
| 2023 | $6,156 | $322,200 | $54,700 | $267,500 |
| 2022 | $6,108 | $270,100 | $47,500 | $222,600 |
| 2021 | $5,982 | $270,100 | $47,500 | $222,600 |
| 2020 | $6,208 | $248,300 | $43,700 | $204,600 |
| 2019 | $5,722 | $248,300 | $43,700 | $204,600 |
| 2018 | $5,658 | $221,400 | $38,100 | $183,300 |
| 2017 | $5,284 | $221,400 | $38,100 | $183,300 |
| 2016 | $5,144 | $203,900 | $34,700 | $169,200 |
| 2015 | $5,144 | $203,900 | $34,700 | $169,200 |
| 2014 | $4,416 | $181,400 | $30,300 | $151,100 |
Source: Public Records
Map
Nearby Homes
Your Personal Tour Guide
Ask me questions while you tour the home.