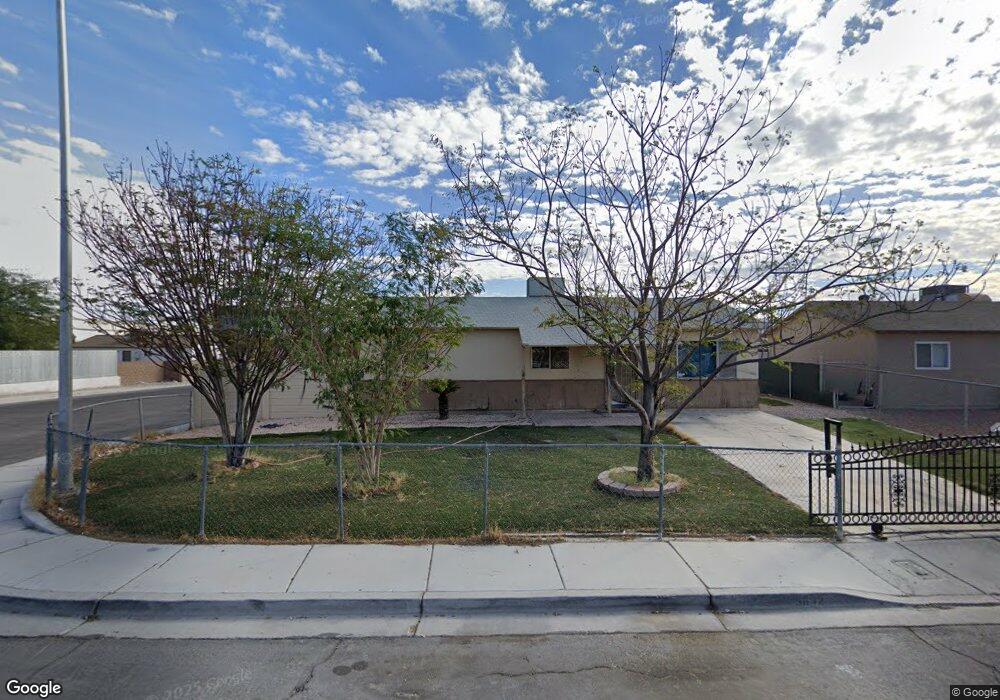
3632 Basin St Unit 3 North Las Vegas, NV 89030
Downtown North Las Vegas NeighborhoodEstimated Value: $310,322 - $350,000
4
Beds
2
Baths
1,330
Sq Ft
$249/Sq Ft
Est. Value
About This Home
This home is located at 3632 Basin St Unit 3, North Las Vegas, NV 89030 and is currently estimated at $331,081, approximately $248 per square foot. 3632 Basin St Unit 3 is a home located in Clark County with nearby schools including Lois Craig Elementary School, Marvin M Sedway Middle School, and Canyon Springs High School And The Leadership And.
Ownership History
Date
Name
Owned For
Owner Type
Purchase Details
Closed on
Aug 16, 2011
Sold by
Caballero Investments Llc
Bought by
Dehernandez Apolonia De Balion
Current Estimated Value
Purchase Details
Closed on
Jul 21, 2011
Sold by
Mabrey Tina A
Bought by
Caballero Investments Llc
Purchase Details
Closed on
May 4, 2004
Sold by
Jackson Alexis L and Jackson Iris L
Bought by
Mabrey Tina A
Home Financials for this Owner
Home Financials are based on the most recent Mortgage that was taken out on this home.
Original Mortgage
$131,838
Interest Rate
6.29%
Mortgage Type
VA
Purchase Details
Closed on
Mar 11, 1994
Sold by
Jackson Iris L and Escartin Iris L
Bought by
Jackson Alexis L and Jackson Iris L
Home Financials for this Owner
Home Financials are based on the most recent Mortgage that was taken out on this home.
Original Mortgage
$50,300
Interest Rate
7%
Create a Home Valuation Report for This Property
The Home Valuation Report is an in-depth analysis detailing your home's value as well as a comparison with similar homes in the area
Home Values in the Area
Average Home Value in this Area
Purchase History
| Date | Buyer | Sale Price | Title Company |
|---|---|---|---|
| Dehernandez Apolonia De Balion | $33,100 | Fidelity National Title Las | |
| Caballero Investments Llc | $33,100 | Fidelity National Title Las | |
| Mabrey Tina A | $129,000 | Fidelity National Title | |
| Jackson Alexis L | -- | Nevada Title Company |
Source: Public Records
Mortgage History
| Date | Status | Borrower | Loan Amount |
|---|---|---|---|
| Previous Owner | Mabrey Tina A | $131,838 | |
| Previous Owner | Jackson Alexis L | $50,300 |
Source: Public Records
Tax History Compared to Growth
Tax History
| Year | Tax Paid | Tax Assessment Tax Assessment Total Assessment is a certain percentage of the fair market value that is determined by local assessors to be the total taxable value of land and additions on the property. | Land | Improvement |
|---|---|---|---|---|
| 2025 | $765 | $41,272 | $24,500 | $16,772 |
| 2024 | $709 | $41,272 | $24,500 | $16,772 |
| 2023 | $709 | $43,818 | $28,700 | $15,118 |
| 2022 | $657 | $36,747 | $22,400 | $14,347 |
| 2021 | $608 | $35,081 | $21,000 | $14,081 |
| 2020 | $562 | $31,931 | $17,500 | $14,431 |
| 2019 | $527 | $28,649 | $14,000 | $14,649 |
| 2018 | $502 | $26,635 | $12,250 | $14,385 |
| 2017 | $852 | $25,394 | $10,500 | $14,894 |
| 2016 | $472 | $22,357 | $6,650 | $15,707 |
| 2015 | $469 | $19,700 | $3,850 | $15,850 |
| 2014 | $455 | $13,154 | $3,850 | $9,304 |
Source: Public Records
Map
Nearby Homes
- 3508 Rio Robles Dr Unit D
- 3508 Rio Robles Dr Unit C
- 3508 Rio Robles Dr Unit A
- 3501 Orvis St
- 3923 Via Lucia Dr
- 3500 Mercury St Unit F
- 3500 Mercury St Unit A
- 3420 Mercury St Unit B
- 3420 Mercury St Unit H
- 3417 Civic Center Dr Unit B
- 3535 Mercury St Unit E
- 3523 Mercury St Unit G
- 3412 Mercury St Unit I
- 3204 Crawford St
- 3915 Eblick Wash Dr
- 3505 Mercury St Unit A
- 3505 Mercury St Unit B
- 3505 Mercury St Unit G
- 3540 Purdue
- 3975 Eblick Wash Dr
- 3630 Basin St
- 3633 Belmont St Unit 3
- 3631 Belmont St
- 3628 Basin St
- 3700 Basin St
- 3701 Belmont St
- 3629 Belmont St
- 2815 Tulane Cir
- 3629 Basin St
- 3627 Basin St
- 3624 Basin St
- 3704 Basin St
- 3625 Basin St
- 3705 Belmont St
- 3625 Belmont St
- 2809 Tulane Cir
- 3620 Basin St
- 3708 Basin St
- 3621 Basin St
- 3709 Belmont St