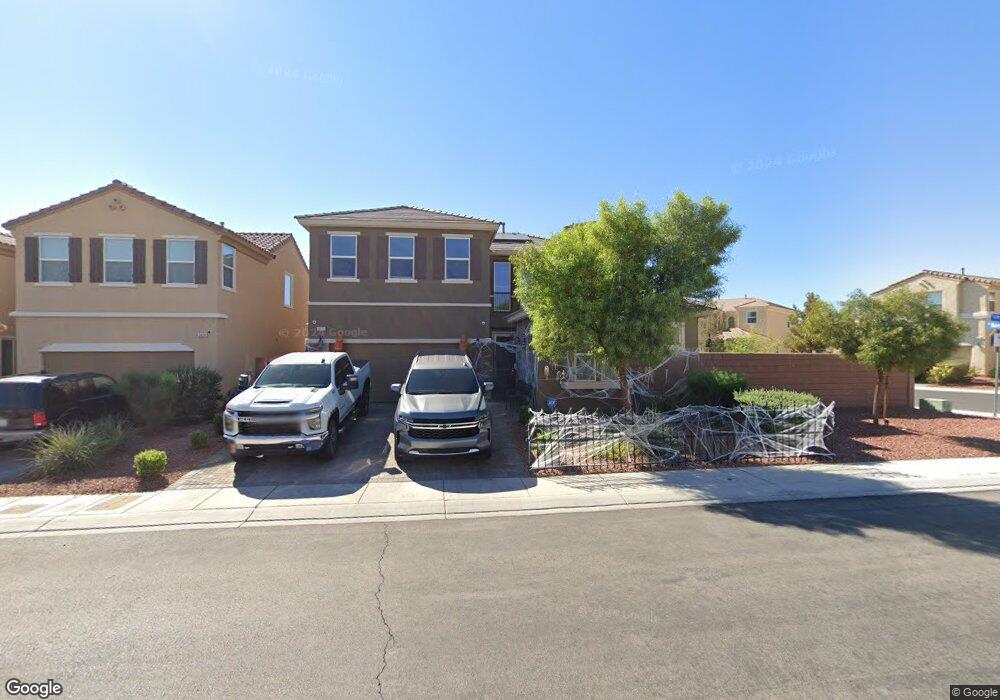
3633 Kingfishers Catch Ave North Las Vegas, NV 89084
Aliante NeighborhoodEstimated Value: $553,000 - $579,000
3
Beds
3
Baths
2,620
Sq Ft
$216/Sq Ft
Est. Value
About This Home
This home is located at 3633 Kingfishers Catch Ave, North Las Vegas, NV 89084 and is currently estimated at $566,807, approximately $216 per square foot. 3633 Kingfishers Catch Ave is a home with nearby schools including Vincent L. Triggs Elementary School, Anthony Saville Middle School, and Shadow Ridge High School.
Ownership History
Date
Name
Owned For
Owner Type
Purchase Details
Closed on
Jan 22, 2013
Sold by
Harmony Fields Llc
Bought by
Buyco Joaquin R and Ramirez Mardon Y
Current Estimated Value
Home Financials for this Owner
Home Financials are based on the most recent Mortgage that was taken out on this home.
Original Mortgage
$206,883
Outstanding Balance
$146,376
Interest Rate
3.75%
Mortgage Type
FHA
Estimated Equity
$420,431
Purchase Details
Closed on
Jun 30, 2010
Sold by
Richmond American Homes Of Nevada Inc
Bought by
Harmony Fields Llc
Purchase Details
Closed on
Dec 29, 2009
Sold by
Boc Southeast Holdings Company
Bought by
Richmond American Homes Of Nevada Inc
Purchase Details
Closed on
Dec 10, 2008
Sold by
Astoria Nlv 53 Llc
Bought by
Boc Southeast Holdings Company
Create a Home Valuation Report for This Property
The Home Valuation Report is an in-depth analysis detailing your home's value as well as a comparison with similar homes in the area
Home Values in the Area
Average Home Value in this Area
Purchase History
| Date | Buyer | Sale Price | Title Company |
|---|---|---|---|
| Buyco Joaquin R | $210,700 | Fidelity National Title Las | |
| Harmony Fields Llc | $5,255,700 | Chicago Title | |
| Richmond American Homes Of Nevada Inc | $6,004,000 | Chicago Title | |
| Boc Southeast Holdings Company | $6,161,940 | Stewart Title Of Nevada Las |
Source: Public Records
Mortgage History
| Date | Status | Borrower | Loan Amount |
|---|---|---|---|
| Open | Buyco Joaquin R | $206,883 |
Source: Public Records
Tax History Compared to Growth
Tax History
| Year | Tax Paid | Tax Assessment Tax Assessment Total Assessment is a certain percentage of the fair market value that is determined by local assessors to be the total taxable value of land and additions on the property. | Land | Improvement |
|---|---|---|---|---|
| 2025 | $4,453 | $171,437 | $37,100 | $134,337 |
| 2024 | $4,124 | $171,437 | $37,100 | $134,337 |
| 2023 | $2,592 | $165,066 | $39,200 | $125,866 |
| 2022 | $3,818 | $148,134 | $33,600 | $114,534 |
| 2021 | $3,536 | $131,659 | $29,750 | $101,909 |
| 2020 | $3,280 | $125,967 | $29,750 | $96,217 |
| 2019 | $3,074 | $120,896 | $26,600 | $94,296 |
| 2018 | $2,933 | $106,011 | $19,950 | $86,061 |
| 2017 | $3,326 | $99,158 | $19,250 | $79,908 |
| 2016 | $2,592 | $88,291 | $14,350 | $73,941 |
| 2015 | $2,586 | $72,463 | $14,350 | $58,113 |
| 2014 | $2,416 | $9,450 | $9,450 | $0 |
Source: Public Records
Map
Nearby Homes
- 3717 Fledgling Dr
- 3425 Fledgling Dr
- 7020 Villada St
- 7020 Puetollano Dr
- 7037 Puetollano Dr
- 7312 Pinfeather Way
- 7316 Bugler Swan Way
- 7264 Summer Duck Way
- 7381 Summer Duck Way
- 7209 Millerbird St
- 7073 Seabirds Place
- 7332 Redhead Dr
- 3624 Pelican Brief Ln
- 3721 Alcantara Ln
- 3237 Perching Bird Ln
- 4104 Fabulous Finches Ave
- 7416 Redhead Dr
- 3805 Avian Ct
- 4116 Mantle Ave
- 4208 Falcons Flight Ave
- 3629 W Kingfishers Catch Ave
- 3625 Kingfishers Catch Ave
- 7149 Weavers Place
- 3632 Kingfishers Catch Ave
- 7153 Weavers Place
- 3628 W Kingfishers Catch Ave
- 3621 Kingfishers Catch Ave
- 7157 Weavers Place
- 7145 Weavers Place
- 7136 Weavers Place
- 3624 Kingfishers Catch Ave
- 7141 Weavers Place
- 3620 Kingfishers Catch Ave
- 3617 Kingfishers Catch Ave
- 7137 Weavers Place
- 3640 Kingfishers Catch Ave
- 3616 Kingfishers Catch Ave
- 3613 W Kingfishers Catch Ave
- 7128 Weavers Place
- 3612 Kingfishers Catch Ave