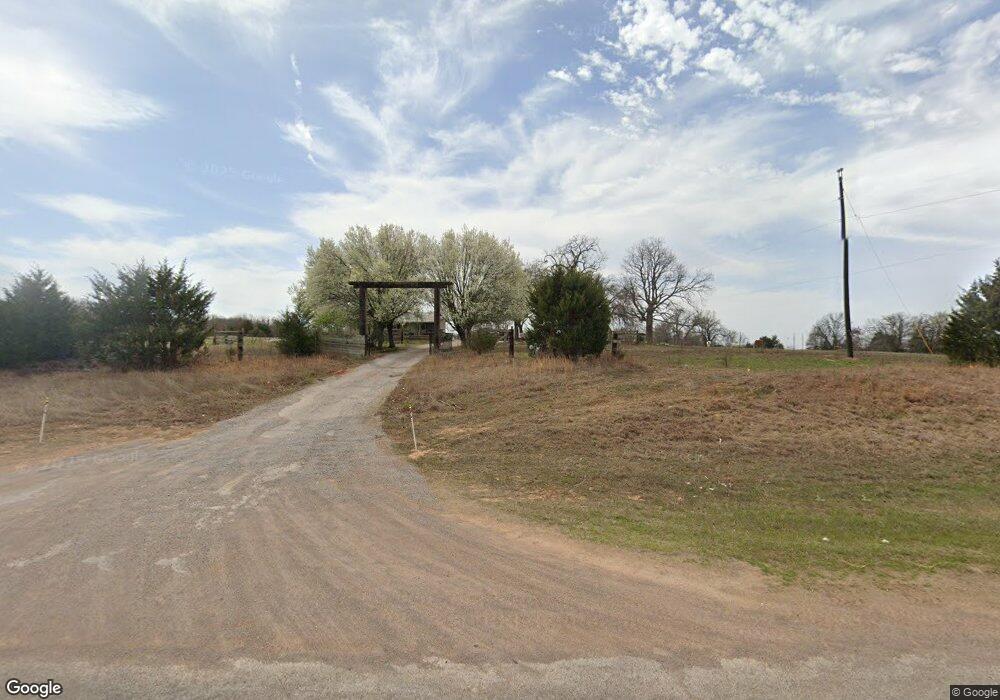
36331 Highway 9 Tecumseh, OK 74873
Estimated Value: $194,248 - $257,000
2
Beds
1
Bath
1,104
Sq Ft
$209/Sq Ft
Est. Value
About This Home
This home is located at 36331 Highway 9, Tecumseh, OK 74873 and is currently estimated at $230,812, approximately $209 per square foot. 36331 Highway 9 is a home located in Pottawatomie County with nearby schools including Cross Timbers Elementary School, Barnard Elementary School, and Tecumseh Middle School.
Ownership History
Date
Name
Owned For
Owner Type
Purchase Details
Closed on
Sep 9, 2009
Sold by
Landers Harry Ronald and Landers Shelley
Bought by
Mann Flora M
Current Estimated Value
Home Financials for this Owner
Home Financials are based on the most recent Mortgage that was taken out on this home.
Original Mortgage
$137,365
Outstanding Balance
$90,155
Interest Rate
5.26%
Mortgage Type
FHA
Estimated Equity
$140,657
Purchase Details
Closed on
Jun 10, 2005
Sold by
Kidney D Spence and Kidney Allison J
Bought by
Landers Ii Harry Ronald
Home Financials for this Owner
Home Financials are based on the most recent Mortgage that was taken out on this home.
Original Mortgage
$26,100
Interest Rate
5.76%
Mortgage Type
Stand Alone Second
Purchase Details
Closed on
Aug 31, 1998
Sold by
Reece Jack and Reece Tammy
Bought by
Spence Kidney D and Spence Spence
Create a Home Valuation Report for This Property
The Home Valuation Report is an in-depth analysis detailing your home's value as well as a comparison with similar homes in the area
Home Values in the Area
Average Home Value in this Area
Purchase History
| Date | Buyer | Sale Price | Title Company |
|---|---|---|---|
| Mann Flora M | $140,000 | None Available | |
| Landers Ii Harry Ronald | $130,500 | None Available | |
| Spence Kidney D | $70,000 | -- |
Source: Public Records
Mortgage History
| Date | Status | Borrower | Loan Amount |
|---|---|---|---|
| Open | Mann Flora M | $137,365 | |
| Previous Owner | Landers Ii Harry Ronald | $26,100 | |
| Previous Owner | Landers Ii Harry Ronald | $104,400 |
Source: Public Records
Tax History Compared to Growth
Tax History
| Year | Tax Paid | Tax Assessment Tax Assessment Total Assessment is a certain percentage of the fair market value that is determined by local assessors to be the total taxable value of land and additions on the property. | Land | Improvement |
|---|---|---|---|---|
| 2024 | $808 | $8,811 | $1,458 | $7,353 |
| 2023 | $808 | $8,554 | $918 | $7,636 |
| 2022 | $775 | $8,554 | $918 | $7,636 |
| 2021 | $785 | $8,554 | $918 | $7,636 |
| 2020 | $812 | $8,861 | $918 | $7,943 |
| 2019 | $836 | $9,013 | $918 | $8,095 |
| 2018 | $866 | $9,273 | $918 | $8,355 |
| 2017 | $879 | $9,328 | $918 | $8,410 |
| 2016 | $804 | $9,479 | $918 | $8,561 |
| 2015 | $798 | $9,437 | $918 | $8,519 |
| 2014 | $776 | $9,206 | $918 | $8,288 |
Source: Public Records
Map
Nearby Homes
- 21896 Lilly Dr
- 20832 Drummond Rd
- 38570 Highway 9
- 37261 Willow View Rd
- 37477 Willow View Rd
- 21320 Oklahoma 102
- 22650 Rio Bravo
- 107 Pine Valley Ln
- 34654 Sunset Oaks Dr
- 102 Pine Valley Ln
- 20239 Bern Ln
- 00 Whispering Oaks Rd
- 22202 Oklahoma 102
- 20269 Fairbanks Ln
- 00 Oak Ridge Rd
- 20265 Fairbanks Ln
- 00 Highland 8 87 Acres Rd
- 19301 Sharon Rd
- 80 AC Sandy Rock Rd
- 3 Raymond Rd
- 36424 Highway 9
- 36462 Highway 9
- 36107 Highway 9
- 36254 Highway 9
- 36570 Highway 9
- 36594 Oklahoma 9
- 36594 Highway 9
- 21101 Bethel Rd
- 36709 Highway 9
- 21205 Bethel Rd
- 20825 Bethel Rd
- 36695 Highway 9
- 36707 Highway 9
- 36744 Highway 9
- 21371 Bethel Rd
- 21311 Bethel Rd
- 20805 Bethel Rd
- 21258 Bethel Rd
- 20812 Bethel Rd
- 35900 Highway 9