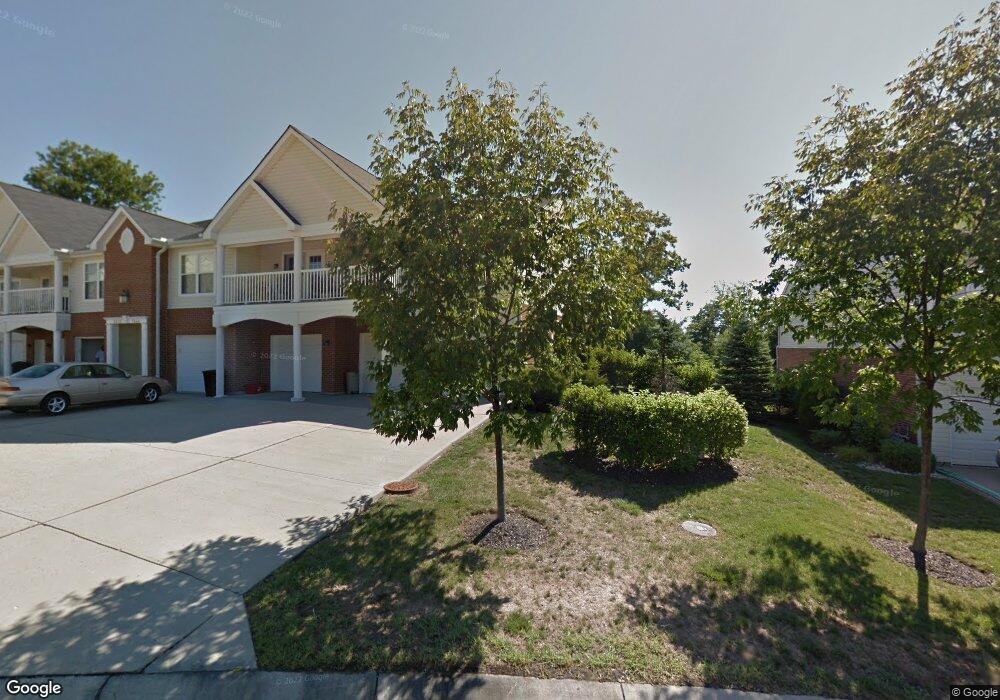
3634 Chestnut Park Unit 38 Cleves, OH 45002
Estimated Value: $212,000 - $227,000
3
Beds
2
Baths
1,382
Sq Ft
$159/Sq Ft
Est. Value
About This Home
This home is located at 3634 Chestnut Park Unit 38, Cleves, OH 45002 and is currently estimated at $219,287, approximately $158 per square foot. 3634 Chestnut Park Unit 38 is a home located in Hamilton County with nearby schools including Charles T. Young Elementary School, Taylor Middle School, and Taylor High School.
Ownership History
Date
Name
Owned For
Owner Type
Purchase Details
Closed on
Feb 27, 2013
Sold by
Kennedy Thomas L and Kennedy Emily
Bought by
Brockman Carl
Current Estimated Value
Purchase Details
Closed on
Mar 29, 2007
Sold by
Bohinski Frank E
Bought by
Kennedy Thomas L
Home Financials for this Owner
Home Financials are based on the most recent Mortgage that was taken out on this home.
Original Mortgage
$117,725
Interest Rate
6.25%
Mortgage Type
Unknown
Purchase Details
Closed on
Jun 17, 2003
Sold by
Tdggc Llc
Bought by
Bohinski Frank E
Home Financials for this Owner
Home Financials are based on the most recent Mortgage that was taken out on this home.
Original Mortgage
$107,760
Interest Rate
5.4%
Mortgage Type
Purchase Money Mortgage
Create a Home Valuation Report for This Property
The Home Valuation Report is an in-depth analysis detailing your home's value as well as a comparison with similar homes in the area
Home Values in the Area
Average Home Value in this Area
Purchase History
| Date | Buyer | Sale Price | Title Company |
|---|---|---|---|
| Brockman Carl | $95,000 | Attorney | |
| Kennedy Thomas L | $138,500 | Attorney | |
| Bohinski Frank E | $134,700 | First Title Agency Inc |
Source: Public Records
Mortgage History
| Date | Status | Borrower | Loan Amount |
|---|---|---|---|
| Previous Owner | Kennedy Thomas L | $117,725 | |
| Previous Owner | Bohinski Frank E | $107,760 |
Source: Public Records
Tax History Compared to Growth
Tax History
| Year | Tax Paid | Tax Assessment Tax Assessment Total Assessment is a certain percentage of the fair market value that is determined by local assessors to be the total taxable value of land and additions on the property. | Land | Improvement |
|---|---|---|---|---|
| 2024 | $2,942 | $63,025 | $7,875 | $55,150 |
| 2023 | $2,944 | $63,025 | $7,875 | $55,150 |
| 2022 | $2,500 | $41,846 | $6,146 | $35,700 |
| 2021 | $2,435 | $41,846 | $6,146 | $35,700 |
| 2020 | $2,456 | $41,846 | $6,146 | $35,700 |
| 2019 | $2,326 | $36,705 | $5,390 | $31,315 |
| 2018 | $2,236 | $36,705 | $5,390 | $31,315 |
| 2017 | $2,098 | $36,705 | $5,390 | $31,315 |
| 2016 | $1,847 | $33,250 | $5,460 | $27,790 |
| 2015 | $1,865 | $33,250 | $5,460 | $27,790 |
| 2014 | $1,884 | $33,250 | $5,460 | $27,790 |
| 2013 | $2,580 | $46,550 | $7,000 | $39,550 |
Source: Public Records
Map
Nearby Homes
- 3596 Chestnut Park Ln
- 3600 Chestnut Park Ln
- 3594 Chestnut Park Ln
- 3693 Chestnut Park Ln
- 3503 Chestnut Park Ln
- 3498 Chestnut Park Ln
- 3736 Bremen Pass
- 3813 Beacon Woods Dr
- 3829 Legendary Ridge Ln
- 3894 Bremen Pass
- 3601 Chadwell Springs Ct
- 3830 Nottingham Ct
- 8735 Bridgetown Rd
- 7957 Rio Grande Dr
- 8229 Charlies Way
- 8708 Quietwood Ln
- Chattanooga Plan at Indian Walk
- Rockford Plan at Indian Walk
- Carlisle Plan at Indian Walk
- Miramar Plan at Indian Walk
- 3644 Chestnut Park Unit 31
- 3640 Chestnut Park
- 3630 Chestnut Park
- 3636 Chestnut Park Ln Unit 6
- 3644 Chestnut Park Unit LANE
- 3634 Chestnut Park Unit LANE
- 3636 Chestnut Park
- 3642 Chestnut Park
- 3642 Chestnut Park Unit LANE
- 3616 Chestnut Park Ln
- 3634 Chestnut Park Ln
- 3644 Chestnut Park Ln Unit 1
- 3646 Chestnut Park
- 3646 Chestnut Park Unit LANE
- 3632 Chestnut Park Unit 32
- 3620 Chestnut Park
- 3660 Chestnut Park
- 3660 Chestnut Park Unit LANE
- 3616 Chestnut Park Unit 46
- 3624 Chestnut Park Unit 41