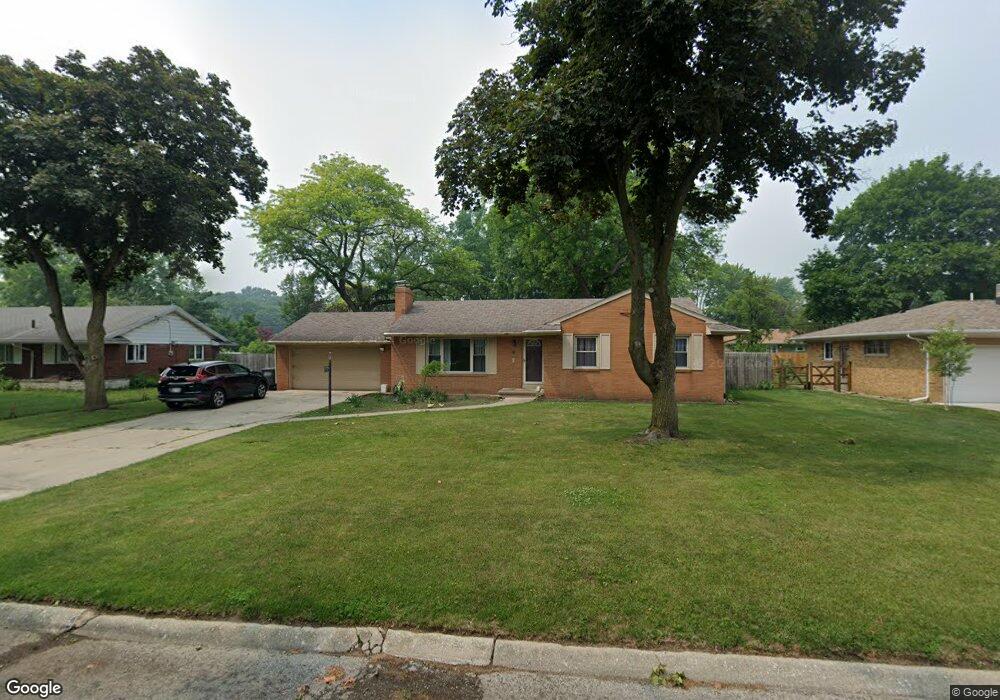
3634 Denise Dr Toledo, OH 43614
Glendale-Heatherdowns NeighborhoodEstimated Value: $201,000 - $218,000
3
Beds
2
Baths
1,235
Sq Ft
$168/Sq Ft
Est. Value
About This Home
This home is located at 3634 Denise Dr, Toledo, OH 43614 and is currently estimated at $206,887, approximately $167 per square foot. 3634 Denise Dr is a home located in Lucas County with nearby schools including Byrnedale Elementary School, Bowsher High School, and Northwest Ohio Classical Academy.
Ownership History
Date
Name
Owned For
Owner Type
Purchase Details
Closed on
Mar 4, 2022
Sold by
Lake Pruk
Bought by
Pruk Lake and Pruksajaroenpong Phuchit
Current Estimated Value
Purchase Details
Closed on
Jan 14, 2011
Sold by
Dankratok Virat P
Bought by
Pruk Lake and Pruksajaroenpong Paphaphorn
Purchase Details
Closed on
Dec 29, 2009
Sold by
Hagenbuch Craig R and Hagenbuch Julie K
Bought by
Dankratok Virat and Pruksajaroepong Papaphorn
Home Financials for this Owner
Home Financials are based on the most recent Mortgage that was taken out on this home.
Original Mortgage
$76,313
Interest Rate
4.9%
Mortgage Type
FHA
Purchase Details
Closed on
Oct 5, 2009
Sold by
Hagenbuck Craig R and Hagenbuch Julie K
Bought by
Hagenbuch Craig R and Hagenbuch Julie K
Purchase Details
Closed on
Apr 28, 1994
Sold by
Kearney Michael P and Kearney Diane
Purchase Details
Closed on
Feb 26, 1988
Sold by
Holtz Louis E
Create a Home Valuation Report for This Property
The Home Valuation Report is an in-depth analysis detailing your home's value as well as a comparison with similar homes in the area
Home Values in the Area
Average Home Value in this Area
Purchase History
| Date | Buyer | Sale Price | Title Company |
|---|---|---|---|
| Pruk Lake | -- | Area Title | |
| Pruk Lake | -- | Attorney | |
| Dankratok Virat | $128,500 | Attorney | |
| Hagenbuch Craig R | -- | Attorney | |
| -- | $100,000 | -- | |
| -- | $77,500 | -- |
Source: Public Records
Mortgage History
| Date | Status | Borrower | Loan Amount |
|---|---|---|---|
| Previous Owner | Dankratok Virat | $76,313 |
Source: Public Records
Tax History Compared to Growth
Tax History
| Year | Tax Paid | Tax Assessment Tax Assessment Total Assessment is a certain percentage of the fair market value that is determined by local assessors to be the total taxable value of land and additions on the property. | Land | Improvement |
|---|---|---|---|---|
| 2024 | $1,798 | $51,660 | $12,320 | $39,340 |
| 2023 | $2,895 | $43,610 | $10,465 | $33,145 |
| 2022 | $2,943 | $43,610 | $10,465 | $33,145 |
| 2021 | $3,005 | $43,610 | $10,465 | $33,145 |
| 2020 | $2,858 | $36,295 | $8,715 | $27,580 |
| 2019 | $2,792 | $36,295 | $8,715 | $27,580 |
| 2018 | $2,893 | $36,295 | $8,715 | $27,580 |
| 2017 | $4,685 | $37,730 | $7,665 | $30,065 |
| 2016 | $3,022 | $107,800 | $21,900 | $85,900 |
| 2015 | $2,996 | $107,800 | $21,900 | $85,900 |
| 2014 | $2,439 | $37,740 | $7,670 | $30,070 |
| 2013 | $2,439 | $37,740 | $7,670 | $30,070 |
Source: Public Records
Map
Nearby Homes
- 3607 Roberta Dr
- 1302 E Beverly Hills Dr
- 1518 Wilmore Dr
- 3813 Glendale Ave
- 3729 Linden Green Dr
- 1518 Cherrylawn Dr
- 1629 Carmelle Ct
- 3118 Muirfield Ave
- 1953 Heatherlawn Dr
- 1919 Colony Dr
- 1848 Brierheath Ave
- 3651 Treelawn Dr
- 3042 Schneider Rd
- 4073 Grandview Ct
- 3042 Cragmoor Ave
- 1351 Bensch Dr
- 3157 Strathmoor Ave
- 1969 Oaklawn Dr
- 1553 Heather Meadow Dr
- 3662 Perlawn Dr
- 3624 Denise Dr
- 3644 Denise Dr
- 3633 Camille Dr
- 3623 Camille Dr
- 3616 Denise Dr
- 3633 Denise Dr
- 3623 Denise Dr
- 3643 Denise Dr
- 3615 Camille Dr
- 3615 Denise Dr
- 3606 Denise Dr
- 1358 Juliet Dr
- 1348 Juliet Dr
- 1402 Juliet Dr
- 3605 Camille Dr
- 1340 Juliet Dr
- 3634 Camille Dr
- 3634 Brenda Dr
- 3624 Camille Dr
- 3644 Camille Dr