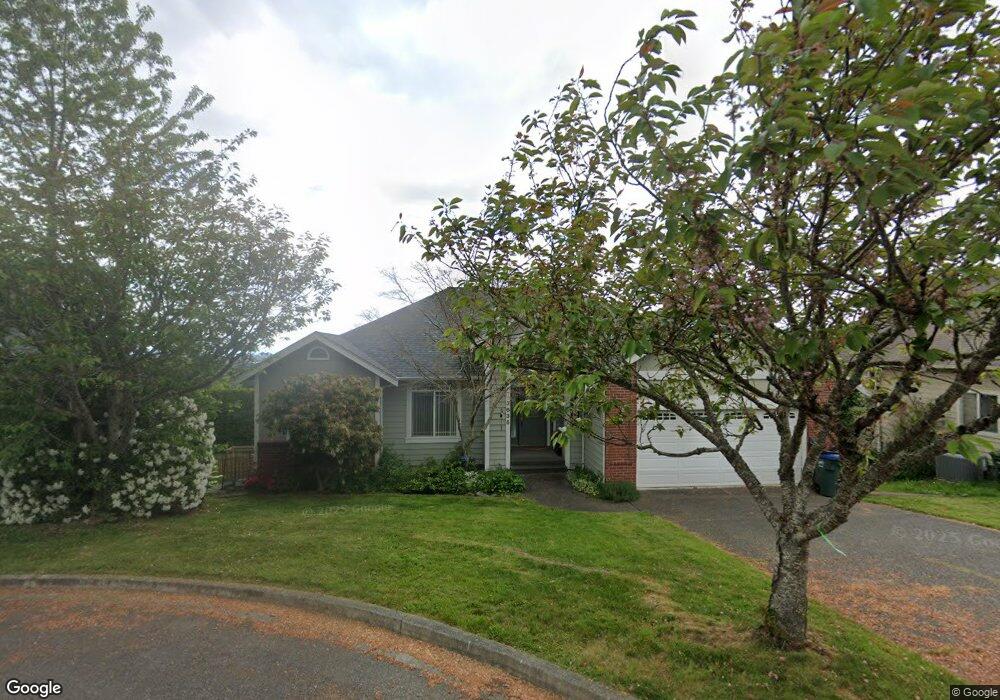
3635 S Pebble Place Bellingham, WA 98226
Barkley NeighborhoodEstimated Value: $934,000 - $990,721
4
Beds
3
Baths
3,051
Sq Ft
$314/Sq Ft
Est. Value
About This Home
This home is located at 3635 S Pebble Place, Bellingham, WA 98226 and is currently estimated at $958,180, approximately $314 per square foot. 3635 S Pebble Place is a home located in Whatcom County with nearby schools including Northern Heights Elementary School, Shuksan Middle School, and Squalicum High School.
Ownership History
Date
Name
Owned For
Owner Type
Purchase Details
Closed on
Jun 14, 2018
Sold by
Kuenzel Robert V and Pollack Anne R
Bought by
Kuenzel Robert V and Pollack Anne R
Current Estimated Value
Purchase Details
Closed on
Apr 17, 2018
Sold by
U S Bank National Association
Bought by
Kuenzel Robert V and Pollack Anne R
Purchase Details
Closed on
Jan 8, 2018
Sold by
Mccauley Ricky R and Mccauley Lisa Darlene
Bought by
Us Bank National Association
Purchase Details
Closed on
Jan 3, 2000
Sold by
Mccauley Ricky R
Bought by
Mccauley Ricky R and Mccauley Lisa Darlene
Purchase Details
Closed on
Jan 21, 1999
Sold by
D & L Construction Co
Bought by
Mccauley Ricky R
Create a Home Valuation Report for This Property
The Home Valuation Report is an in-depth analysis detailing your home's value as well as a comparison with similar homes in the area
Home Values in the Area
Average Home Value in this Area
Purchase History
| Date | Buyer | Sale Price | Title Company |
|---|---|---|---|
| Kuenzel Robert V | -- | None Available | |
| Kuenzel Robert V | $555,000 | None Available | |
| Us Bank National Association | -- | First Amer Title Ins Co | |
| Mccauley Ricky R | -- | Chicago Title Insurance Co | |
| Mccauley Ricky R | $239,900 | Chicago Title Insurance |
Source: Public Records
Tax History Compared to Growth
Tax History
| Year | Tax Paid | Tax Assessment Tax Assessment Total Assessment is a certain percentage of the fair market value that is determined by local assessors to be the total taxable value of land and additions on the property. | Land | Improvement |
|---|---|---|---|---|
| 2024 | $6,977 | $858,926 | $303,899 | $555,027 |
| 2023 | $6,977 | $896,694 | $317,262 | $579,432 |
| 2022 | $6,038 | $786,574 | $278,300 | $508,274 |
| 2021 | $6,004 | $650,061 | $230,000 | $420,061 |
| 2020 | $5,804 | $610,044 | $233,655 | $376,389 |
| 2019 | $6,298 | $570,000 | $218,475 | $351,525 |
| 2018 | $6,518 | $620,160 | $195,975 | $424,185 |
| 2017 | $5,667 | $548,723 | $173,400 | $375,323 |
| 2016 | $5,187 | $498,663 | $157,800 | $340,863 |
| 2015 | $5,216 | $475,096 | $150,000 | $325,096 |
| 2014 | -- | $462,240 | $144,480 | $317,760 |
| 2013 | -- | $442,557 | $140,000 | $302,557 |
Source: Public Records
Map
Nearby Homes
- 1314 Welling Rd
- 3713 Bristol St
- 3709 Bristol St
- 3527 Sussex Dr
- 1379 Northwood Ct
- 3159 Chandler Pkwy
- 3155 Chandler Pkwy
- 3153 Chandler Pkwy
- 3010 E Sunset Dr
- 3001 E Sunset Dr
- 1430 Welling Rd
- 3606 Tree Farm Ct
- 4055 Springland Ct
- 3785 Greenville Place
- 1368 Roma Rd
- 2809 E Sunset Dr
- 3715 E Sunset Dr
- 3817 E Sunset Dr
- 0 E Bakerview Rd Unit NWM2398341
- 3871 Cindy Ln
- 3643 S Pebble Place
- 3627 S Pebble Place
- 3648 S Heather Place
- 3640 S Heather Place
- 3656 S Heather Place
- 3651 S Pebble Place
- 3619 S Pebble Place
- 3632 S Heather Place
- 3664 S Heather Place
- 3630 S Pebble Place
- 3638 S Pebble Place
- 3608 S Pebble Place
- 3659 S Pebble Place
- 3672 S Heather Place
- 3624 S Heather Place
- 3646 S Pebble Place
- 3622 S Pebble Place
- 3654 S Pebble Place
- 3653 S Heather Place
- 3680 S Heather Place