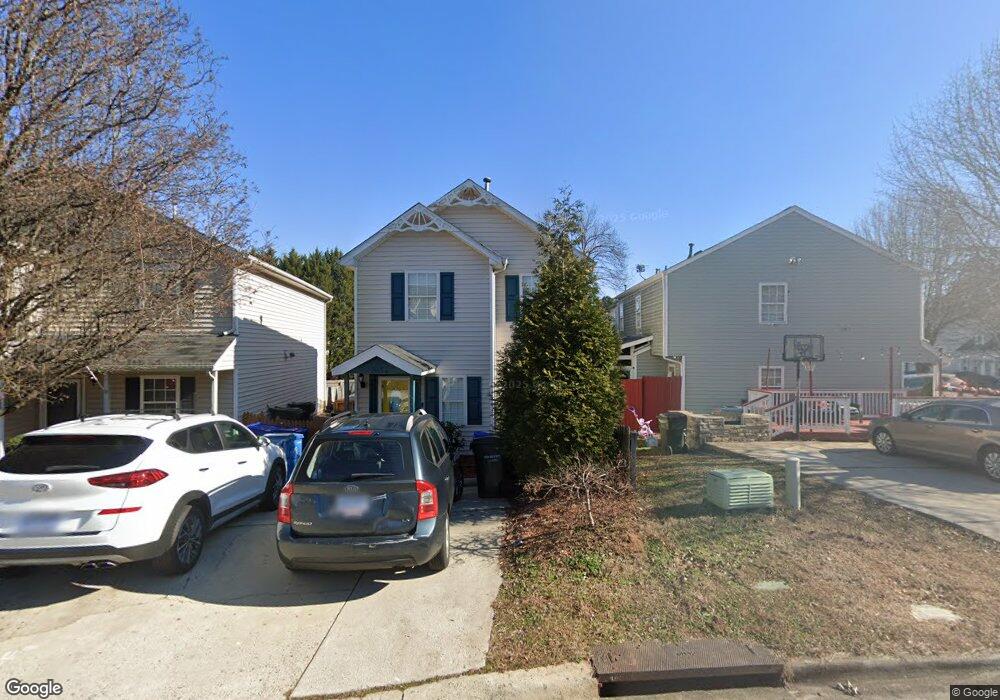
3635 Sana Ct Durham, NC 27713
Woodcroft NeighborhoodEstimated Value: $263,000 - $305,913
3
Beds
2
Baths
1,088
Sq Ft
$261/Sq Ft
Est. Value
About This Home
This home is located at 3635 Sana Ct, Durham, NC 27713 and is currently estimated at $284,478, approximately $261 per square foot. 3635 Sana Ct is a home located in Durham County with nearby schools including Pearsontown Elementary School, Lowe's Grove Middle, and Hillside High School.
Ownership History
Date
Name
Owned For
Owner Type
Purchase Details
Closed on
Sep 5, 2019
Sold by
Grainger Kimberly Cogdell and Grainger Wayne
Bought by
Roncancio Hugo and Arteaga Beatriz
Current Estimated Value
Home Financials for this Owner
Home Financials are based on the most recent Mortgage that was taken out on this home.
Original Mortgage
$125,750
Outstanding Balance
$114,040
Interest Rate
5.5%
Mortgage Type
Adjustable Rate Mortgage/ARM
Estimated Equity
$170,438
Purchase Details
Closed on
Aug 18, 2005
Sold by
Randall Nicole Shelise
Bought by
Cogdell Kimberly J
Home Financials for this Owner
Home Financials are based on the most recent Mortgage that was taken out on this home.
Original Mortgage
$109,900
Interest Rate
5.57%
Mortgage Type
Fannie Mae Freddie Mac
Purchase Details
Closed on
Mar 2, 1999
Sold by
Anderson Homes Inc
Bought by
Randall Nicole Shelise
Home Financials for this Owner
Home Financials are based on the most recent Mortgage that was taken out on this home.
Original Mortgage
$95,800
Interest Rate
6.82%
Create a Home Valuation Report for This Property
The Home Valuation Report is an in-depth analysis detailing your home's value as well as a comparison with similar homes in the area
Home Values in the Area
Average Home Value in this Area
Purchase History
| Date | Buyer | Sale Price | Title Company |
|---|---|---|---|
| Roncancio Hugo | $160,000 | None Available | |
| Cogdell Kimberly J | $110,000 | -- | |
| Randall Nicole Shelise | $99,000 | -- |
Source: Public Records
Mortgage History
| Date | Status | Borrower | Loan Amount |
|---|---|---|---|
| Open | Roncancio Hugo | $125,750 | |
| Previous Owner | Cogdell Kimberly J | $109,900 | |
| Previous Owner | Randall Nicole Shelise | $95,800 |
Source: Public Records
Tax History
| Year | Tax Paid | Tax Assessment Tax Assessment Total Assessment is a certain percentage of the fair market value that is determined by local assessors to be the total taxable value of land and additions on the property. | Land | Improvement |
|---|---|---|---|---|
| 2025 | $2,857 | $288,198 | $117,600 | $170,598 |
| 2024 | $2,200 | $157,702 | $33,450 | $124,252 |
| 2023 | $2,066 | $157,702 | $33,450 | $124,252 |
| 2022 | $2,018 | $157,702 | $33,450 | $124,252 |
| 2021 | $2,009 | $157,702 | $33,450 | $124,252 |
| 2020 | $1,962 | $157,702 | $33,450 | $124,252 |
| 2019 | $1,962 | $157,702 | $33,450 | $124,252 |
| 2018 | $1,633 | $120,374 | $27,875 | $92,499 |
| 2017 | $1,621 | $120,374 | $27,875 | $92,499 |
| 2016 | $1,566 | $120,374 | $27,875 | $92,499 |
| 2015 | $1,585 | $114,515 | $29,692 | $84,823 |
| 2014 | $1,585 | $114,515 | $29,692 | $84,823 |
Source: Public Records
Map
Nearby Homes
- 3631 Sugar Tree Place
- 3617 Sugar Tree Place
- 1408 Smoky Mountains St
- 3331 Tarleton E Unit 8
- 1518 Smoky Mountains St
- 5315 Reams Run Rd
- 5510 Loyal Ave
- 2 Drakesway Ct
- 3514 S Alston Ave
- 14 E Gleewood Place
- 19 Meadhall Ct
- 1100 Nova St
- 1108 Nova St
- 812 Beebe Dr
- 800 Bluestone Rd
- 545 Bluestone Rd
- 804 Carpenter Fletcher Rd
- 806 Carpenter Fletcher Rd
- 1674 Snowmass Way
- 2717 Wyntercrest Ln
Your Personal Tour Guide
Ask me questions while you tour the home.