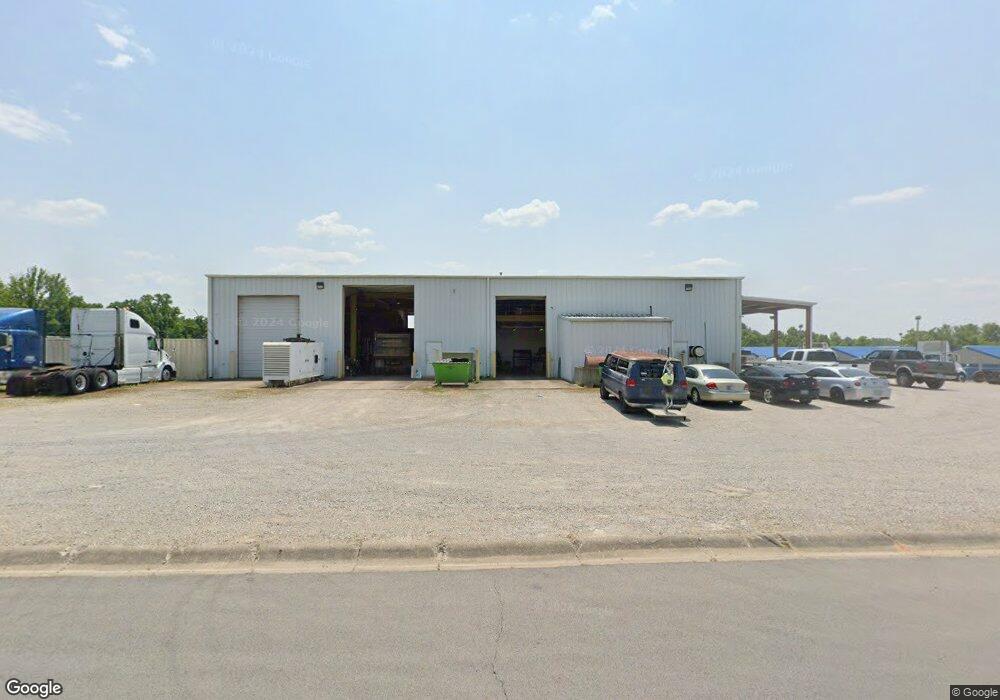
3636 W Frontage Rd Austin, IN 47102
Estimated Value: $653,336
Studio
--
Bath
9,100
Sq Ft
$72/Sq Ft
Est. Value
About This Home
This home is located at 3636 W Frontage Rd, Austin, IN 47102 and is currently estimated at $653,336, approximately $71 per square foot. 3636 W Frontage Rd is a home located in Scott County with nearby schools including Austin Elementary School, Austin Middle School, and Austin High School.
Ownership History
Date
Name
Owned For
Owner Type
Purchase Details
Closed on
Dec 15, 2020
Sold by
Murphy Tex Edward
Bought by
Murphy Joey L
Current Estimated Value
Purchase Details
Closed on
May 30, 2019
Sold by
3636 Frontage Llc
Bought by
Murphy Tex Edward
Purchase Details
Closed on
Jun 29, 2010
Sold by
French I L
Bought by
3636 Frontage Llc
Purchase Details
Closed on
Apr 25, 2007
Sold by
Hunley Sales & Service Inc
Bought by
L French I
Home Financials for this Owner
Home Financials are based on the most recent Mortgage that was taken out on this home.
Original Mortgage
$705,000
Interest Rate
6.18%
Mortgage Type
Commercial
Purchase Details
Closed on
Apr 24, 2007
Sold by
Hunley Everitt and Hunley Linda J
Bought by
French I L
Home Financials for this Owner
Home Financials are based on the most recent Mortgage that was taken out on this home.
Original Mortgage
$705,000
Interest Rate
6.18%
Mortgage Type
Commercial
Create a Home Valuation Report for This Property
The Home Valuation Report is an in-depth analysis detailing your home's value as well as a comparison with similar homes in the area
Home Values in the Area
Average Home Value in this Area
Purchase History
| Date | Buyer | Sale Price | Title Company |
|---|---|---|---|
| Murphy Joey L | -- | None Available | |
| Murphy Tex Edward | -- | None Available | |
| 3636 Frontage Llc | -- | None Available | |
| L French I | $860,000 | North Vernon Abstract | |
| French I L | -- | None Available | |
| French L L | -- | None Available |
Source: Public Records
Mortgage History
| Date | Status | Borrower | Loan Amount |
|---|---|---|---|
| Previous Owner | French I L | $705,000 |
Source: Public Records
Tax History
| Year | Tax Paid | Tax Assessment Tax Assessment Total Assessment is a certain percentage of the fair market value that is determined by local assessors to be the total taxable value of land and additions on the property. | Land | Improvement |
|---|---|---|---|---|
| 2024 | $16,334 | $473,200 | $134,800 | $338,400 |
| 2023 | $11,462 | $314,500 | $134,800 | $179,700 |
| 2022 | $9,651 | $300,900 | $135,000 | $165,900 |
| 2021 | $9,555 | $311,100 | $135,000 | $176,100 |
| 2020 | $9,348 | $311,600 | $135,000 | $176,600 |
| 2019 | $9,348 | $311,600 | $135,000 | $176,600 |
| 2018 | $15,129 | $504,300 | $135,000 | $369,300 |
| 2017 | $14,775 | $492,500 | $135,000 | $357,500 |
| 2016 | $14,658 | $488,600 | $135,000 | $353,600 |
| 2014 | $14,259 | $475,300 | $135,000 | $340,300 |
| 2013 | $14,259 | $475,300 | $135,000 | $340,300 |
Source: Public Records
Map
Nearby Homes
- tbd W Frontage Rd
- 0 W Frontage Rd Unit 200904186
- 2277 W Frontage Rd
- 3686 N Christie Rd
- 3628 N Christie Rd
- 3716 N Christie Rd
- 3594 N Christie Rd
- 3746 N Christie Rd
- 3706 N Christie Rd
- 3794 N Christie Rd
- 814 English Ave
- 812 English Ave
- 810 English Ave
- 3654 N Christie Rd
- 790 English Ave
- 770 English Ave
- 208 N Frontage Rd
- 756 English Ave
- 777 English Ave
- 769 English Ave
Your Personal Tour Guide
Ask me questions while you tour the home.