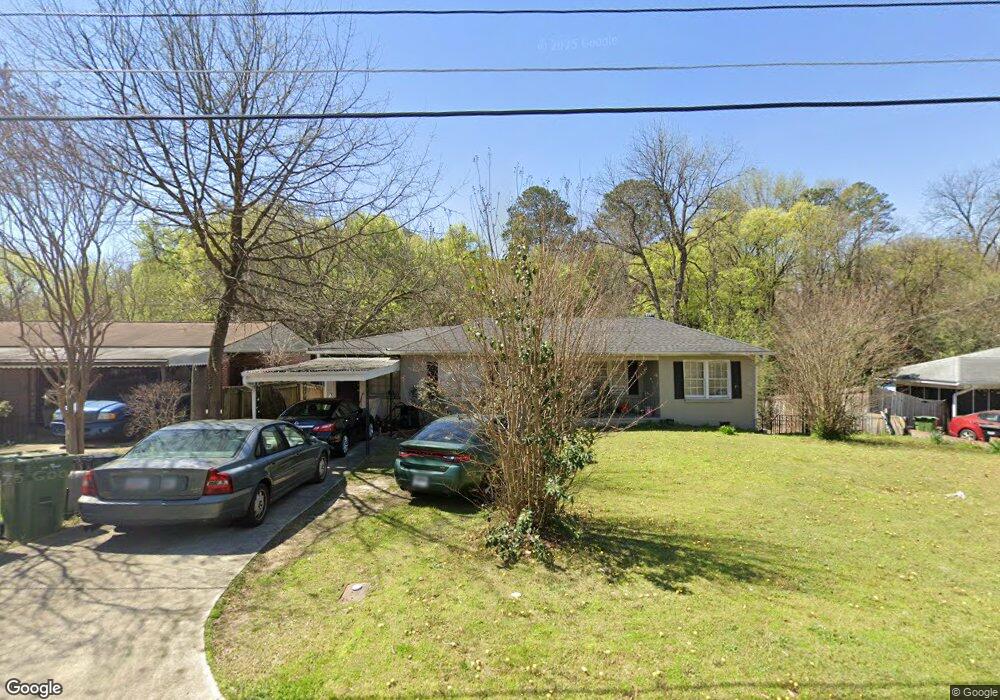
3637 Calvin Dr Columbus, GA 31904
Northern Columbus NeighborhoodEstimated Value: $137,000 - $177,000
3
Beds
3
Baths
1,226
Sq Ft
$127/Sq Ft
Est. Value
About This Home
This home is located at 3637 Calvin Dr, Columbus, GA 31904 and is currently estimated at $155,297, approximately $126 per square foot. 3637 Calvin Dr is a home located in Muscogee County with nearby schools including Johnson Elementary School, Richards Middle School, and Jordan Vocational High School.
Ownership History
Date
Name
Owned For
Owner Type
Purchase Details
Closed on
Mar 31, 2017
Sold by
Big Mamas Stuff Llc
Bought by
Young Leslie A
Current Estimated Value
Home Financials for this Owner
Home Financials are based on the most recent Mortgage that was taken out on this home.
Original Mortgage
$102,150
Outstanding Balance
$84,747
Interest Rate
4.1%
Mortgage Type
VA
Estimated Equity
$70,550
Purchase Details
Closed on
Feb 5, 2015
Sold by
Big Mamas Stuff Llc
Bought by
Howard Michael D
Home Financials for this Owner
Home Financials are based on the most recent Mortgage that was taken out on this home.
Original Mortgage
$77,200
Interest Rate
3.81%
Mortgage Type
New Conventional
Purchase Details
Closed on
Dec 4, 2014
Sold by
Gill Henrietta Gisela
Bought by
Big Mamas Stuff Llc
Purchase Details
Closed on
Nov 3, 2009
Sold by
Chase Home Finance Llc
Bought by
Federal National Mortgage Association
Create a Home Valuation Report for This Property
The Home Valuation Report is an in-depth analysis detailing your home's value as well as a comparison with similar homes in the area
Home Values in the Area
Average Home Value in this Area
Purchase History
| Date | Buyer | Sale Price | Title Company |
|---|---|---|---|
| Young Leslie A | $100,000 | -- | |
| Howard Michael D | $82,500 | -- | |
| Big Mamas Stuff Llc | $44,000 | -- | |
| Federal National Mortgage Association | -- | None Available | |
| Chase Home Finance Llc | $129,500 | None Available |
Source: Public Records
Mortgage History
| Date | Status | Borrower | Loan Amount |
|---|---|---|---|
| Open | Young Leslie A | $102,150 | |
| Previous Owner | Howard Michael D | $77,200 |
Source: Public Records
Tax History Compared to Growth
Tax History
| Year | Tax Paid | Tax Assessment Tax Assessment Total Assessment is a certain percentage of the fair market value that is determined by local assessors to be the total taxable value of land and additions on the property. | Land | Improvement |
|---|---|---|---|---|
| 2025 | $2,116 | $54,068 | $8,092 | $45,976 |
| 2024 | $212 | $54,068 | $8,092 | $45,976 |
| 2023 | $213 | $54,068 | $8,092 | $45,976 |
| 2022 | $1,569 | $38,416 | $8,092 | $30,324 |
| 2021 | $1,580 | $38,692 | $8,092 | $30,600 |
| 2020 | $1,580 | $38,692 | $8,092 | $30,600 |
| 2019 | $1,585 | $38,692 | $8,092 | $30,600 |
| 2018 | $1,585 | $38,692 | $8,092 | $30,600 |
| 2017 | $1,590 | $38,692 | $8,092 | $30,600 |
| 2016 | $814 | $33,000 | $10,108 | $22,892 |
| 2015 | $291 | $17,600 | $10,108 | $7,492 |
| 2014 | $721 | $43,599 | $10,108 | $33,491 |
| 2013 | -- | $43,599 | $10,108 | $33,491 |
Source: Public Records
Map
Nearby Homes
- 3643 Calvin Dr
- 1918 Rosemont Dr
- 0 Warm Springs Rd
- 3905 Crestview Dr
- 1703 39th St
- 1702 40th St
- 2257 Camille Dr
- 2122 40th St
- 3305 Cherokee Ave
- 3248 Cherokee Ave
- 2012 42nd St
- 3232 Hillside Way
- 1717 42nd St
- 4220 18th Ave
- 4109 Sherwood Ave
- 1810 Shannon Dr
- 3105 Woodlawn Ave
- 1719 Slade Dr
- 4214 Saint Francis Ave Unit A
- 4213 16th Ave
- 3631 Calvin Dr
- 3703 Calvin Dr
- 3640 Calvin Dr
- 3704 Calvin Dr
- 3707 Calvin Dr
- 3731 Crestview Dr
- 1914 Rosemont Dr
- 3708 Calvin Dr
- 3712 Phelts Dr
- 3733 Crestview Dr
- 3712 Calvin Dr
- 3735 Crestview Dr
- 1910 Rosemont Dr
- 2019 Warm Springs Rd
- 3706 Phelts Dr
- 2002 Pageland Dr
- 2039 Warm Springs Rd
- 3614 Phelts Dr
- 2001 Pageland Dr
- 3620 Crestview Dr