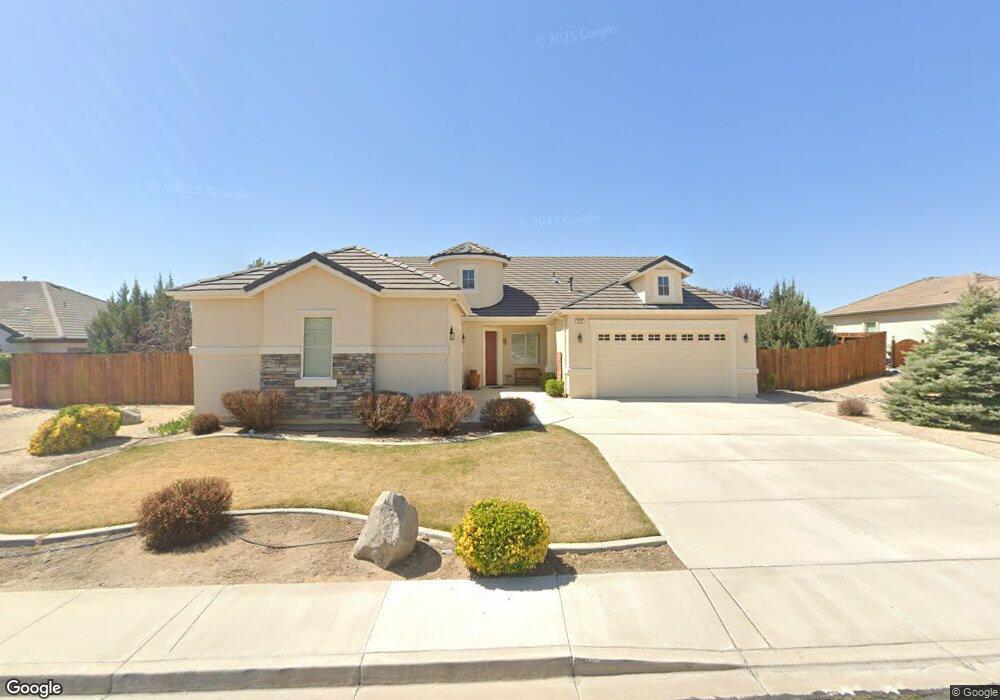
3637 Desert Fox Dr Sparks, NV 89436
Wingfield Springs NeighborhoodEstimated Value: $903,166 - $988,000
3
Beds
3
Baths
2,849
Sq Ft
$331/Sq Ft
Est. Value
About This Home
This home is located at 3637 Desert Fox Dr, Sparks, NV 89436 and is currently estimated at $942,542, approximately $330 per square foot. 3637 Desert Fox Dr is a home located in Washoe County with nearby schools including Spanish Springs Elementary School, Yvonne Shaw Middle School, and Spanish Springs High School.
Ownership History
Date
Name
Owned For
Owner Type
Purchase Details
Closed on
Nov 19, 2008
Sold by
Lennon Terry L and Lennon Teresa M
Bought by
Lennon Terry L and Lennon Teresa M
Current Estimated Value
Purchase Details
Closed on
Jun 9, 2008
Sold by
Lennon Terry L and Lennon Teresa M
Bought by
Lennon Terry L and Lennon Teresa M
Home Financials for this Owner
Home Financials are based on the most recent Mortgage that was taken out on this home.
Original Mortgage
$195,000
Outstanding Balance
$120,712
Interest Rate
5.37%
Mortgage Type
New Conventional
Estimated Equity
$821,830
Purchase Details
Closed on
May 25, 2006
Sold by
Rb & L Cimarron East Llc
Bought by
Lennon Terry L and Lennon Teresa M
Home Financials for this Owner
Home Financials are based on the most recent Mortgage that was taken out on this home.
Original Mortgage
$200,000
Interest Rate
6.5%
Mortgage Type
Purchase Money Mortgage
Purchase Details
Closed on
Aug 1, 2005
Sold by
Cimarron East Llc
Bought by
Rb & L Cimarron East Llc
Create a Home Valuation Report for This Property
The Home Valuation Report is an in-depth analysis detailing your home's value as well as a comparison with similar homes in the area
Home Values in the Area
Average Home Value in this Area
Purchase History
| Date | Buyer | Sale Price | Title Company |
|---|---|---|---|
| Lennon Terry L | -- | None Available | |
| Lennon Terry L | -- | First American Title | |
| Lennon Terry L | $604,000 | First American Title | |
| Rb & L Cimarron East Llc | -- | -- |
Source: Public Records
Mortgage History
| Date | Status | Borrower | Loan Amount |
|---|---|---|---|
| Open | Lennon Terry L | $195,000 | |
| Closed | Lennon Terry L | $200,000 |
Source: Public Records
Tax History Compared to Growth
Tax History
| Year | Tax Paid | Tax Assessment Tax Assessment Total Assessment is a certain percentage of the fair market value that is determined by local assessors to be the total taxable value of land and additions on the property. | Land | Improvement |
|---|---|---|---|---|
| 2025 | $5,658 | $243,123 | $71,663 | $171,461 |
| 2024 | $5,658 | $239,939 | $67,522 | $172,417 |
| 2023 | $5,494 | $245,554 | $83,006 | $162,548 |
| 2022 | $5,334 | $203,907 | $68,551 | $135,356 |
| 2021 | $5,180 | $189,983 | $55,755 | $134,228 |
| 2020 | $5,028 | $190,044 | $55,703 | $134,341 |
| 2019 | $4,882 | $182,984 | $53,813 | $129,171 |
| 2018 | $4,740 | $168,818 | $49,203 | $119,615 |
| 2017 | $4,603 | $165,958 | $47,817 | $118,141 |
| 2016 | $4,487 | $157,901 | $42,714 | $115,187 |
| 2015 | $4,479 | $143,060 | $37,422 | $105,638 |
| 2014 | $4,348 | $118,742 | $29,008 | $89,734 |
| 2013 | -- | $116,426 | $28,224 | $88,202 |
Source: Public Records
Map
Nearby Homes
- 4541 Silian Ct
- 4790 Tobago Dr
- 7816 Casarey Ct
- 7316 Lacerta Dr
- 7393 Star Vista Dr
- 7295 Windswept Loop
- 7777 Rustler Ct
- 7423 Comet Ct
- 7220 Windswept Loop
- 7422 Windswept Loop
- 7221 Windswept Loop
- 7480 Windswept Loop
- 7483 Europa Dr
- 4147 Matter Dr
- 6756 Fabric Dr
- 7260 Treeline Ct
- 7023 Cinder Village Dr
- 3663 Copernicus Ct
- 7718 Rhythm Cir
- 7797 Rhythm Cir
- 3631 Desert Fox Dr
- 3643 Desert Fox Dr
- 3625 Desert Fox Dr
- 3642 Desert Fox Dr
- 3649 Desert Fox Dr
- 4540 Jacmel
- 3648 Desert Fox Dr
- 4560 Jacmel Ct
- 3624 Desert Fox Dr
- 3619 Desert Fox Dr
- 3645 Desert Fox Dr
- 3644 Desert Fox Dr
- 3618 Desert Fox Dr
- 4590 Jacmel Ct
- 3613 Desert Fox Dr
- 3651 Desert Fox Dr
- 4619 Jacmel Ct
- 3650 Desert Fox Dr
- 3612 Desert Fox Dr
- 4610 Jacmel Ct