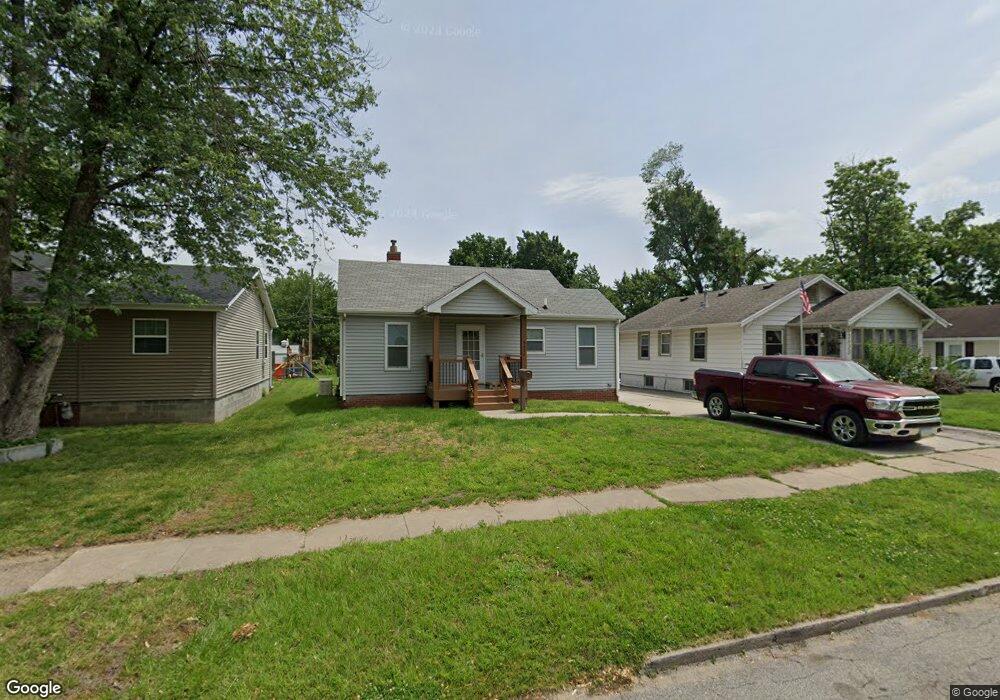
3637 E 7th St Des Moines, IA 50316
Highland Park NeighborhoodEstimated Value: $159,000 - $174,000
2
Beds
1
Bath
732
Sq Ft
$226/Sq Ft
Est. Value
About This Home
This home is located at 3637 E 7th St, Des Moines, IA 50316 and is currently estimated at $165,749, approximately $226 per square foot. 3637 E 7th St is a home located in Polk County with nearby schools including Madison Elementary School, Harding Middle School, and North High School.
Ownership History
Date
Name
Owned For
Owner Type
Purchase Details
Closed on
Feb 23, 2002
Sold by
Munson Edwin Lee and Munson Catherine E
Bought by
Mosset Robert J
Current Estimated Value
Home Financials for this Owner
Home Financials are based on the most recent Mortgage that was taken out on this home.
Original Mortgage
$63,860
Outstanding Balance
$26,144
Interest Rate
6.92%
Mortgage Type
VA
Estimated Equity
$139,605
Purchase Details
Closed on
Jul 21, 1998
Sold by
Guernsey Jean A
Bought by
Guernsey Jean A and Munson Catherine E
Create a Home Valuation Report for This Property
The Home Valuation Report is an in-depth analysis detailing your home's value as well as a comparison with similar homes in the area
Home Values in the Area
Average Home Value in this Area
Purchase History
We collect this data history from publicly available records. To have your information removed, we recommend requesting removal directly through your county’s website.
| Date | Buyer | Sale Price | Title Company |
|---|---|---|---|
| Mosset Robert J | $61,500 | -- | |
| Guernsey Jean A | -- | -- |
Source: Public Records
Mortgage History
We collect this data history from publicly available records. To have your information removed, we recommend requesting removal directly through your county’s website.
| Date | Status | Borrower | Loan Amount |
|---|---|---|---|
| Open | Mosset Robert J | $63,860 |
Source: Public Records
Tax History
| Year | Tax Paid | Tax Assessment Tax Assessment Total Assessment is a certain percentage of the fair market value that is determined by local assessors to be the total taxable value of land and additions on the property. | Land | Improvement |
|---|---|---|---|---|
| 2025 | $1,998 | $147,000 | $33,300 | $113,700 |
| 2024 | $1,998 | $127,700 | $28,600 | $99,100 |
| 2023 | $2,016 | $127,700 | $28,600 | $99,100 |
| 2022 | $1,998 | $97,800 | $23,000 | $74,800 |
| 2021 | $1,862 | $97,800 | $23,000 | $74,800 |
| 2020 | $1,928 | $86,500 | $20,200 | $66,300 |
| 2019 | $1,802 | $86,500 | $20,200 | $66,300 |
| 2018 | $1,776 | $78,800 | $17,900 | $60,900 |
| 2017 | $1,624 | $78,800 | $17,900 | $60,900 |
| 2016 | $1,316 | $71,800 | $16,100 | $55,700 |
| 2015 | $1,316 | $62,000 | $16,100 | $45,900 |
| 2014 | $1,342 | $62,500 | $15,900 | $46,600 |
Source: Public Records
Map
Nearby Homes
- 704 E Euclid Ave
- 3805 Bowdoin St
- 3803 Bowdoin St
- 3914 E 8th St
- 3909 E 8th St
- 616 E Ovid Ave
- 3832 Bowdoin St
- 3901 Bowdoin St
- 3940 E 8th St
- 840 E Ovid Ave
- 3841 Columbia St
- 3814 Columbia St
- 509 E Madison Ave
- 712 E Madison Ave
- 1025 Hoffman Ave
- 1318 E Douglas Ave
- 3301 Columbia St
- 1305 E Oak Park Ave
- 3208 Bowdoin St
- 3120 Amherst St
Your Personal Tour Guide
Ask me questions while you tour the home.