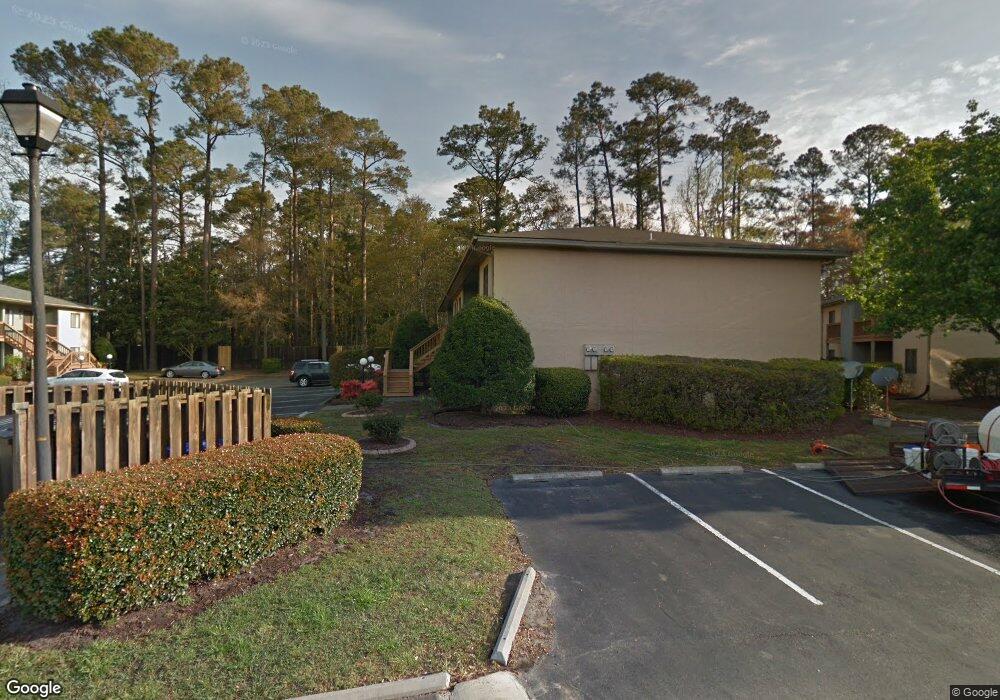
3637 Saint Johns Ct Wilmington, NC 28403
Empie Park NeighborhoodEstimated Value: $200,198 - $214,000
2
Beds
2
Baths
904
Sq Ft
$230/Sq Ft
Est. Value
About This Home
This home is located at 3637 Saint Johns Ct, Wilmington, NC 28403 and is currently estimated at $208,050, approximately $230 per square foot. 3637 Saint Johns Ct is a home located in New Hanover County with nearby schools including Winter Park Model Elementary School, Williston Middle School, and John T. Hoggard High School.
Ownership History
Date
Name
Owned For
Owner Type
Purchase Details
Closed on
Jun 27, 2019
Sold by
Coastal Home Rentals 10 Llc
Bought by
Sarco & Associations Llc
Current Estimated Value
Purchase Details
Closed on
Jan 1, 2019
Sold by
Coastal Home Rentals Llc
Bought by
Coastal Home Rentals 10 Llc
Purchase Details
Closed on
Jul 17, 2017
Sold by
Wilson Charleene J and Wilson Charleene Lance
Bought by
Coastal Home Rentals Llc
Purchase Details
Closed on
May 7, 1998
Sold by
Wilson Charleene
Bought by
Jordan C L Trustee
Purchase Details
Closed on
Mar 1, 1987
Sold by
Stroud Cheryl Ann
Bought by
Wilson Charleene J
Purchase Details
Closed on
Oct 1, 1986
Sold by
Stroud Ann
Bought by
Stroud Cheryl Ann
Purchase Details
Closed on
Apr 1, 1985
Sold by
Park Place Associates
Bought by
Stroud Ann
Purchase Details
Closed on
Aug 1, 1984
Bought by
Park Place Associates
Create a Home Valuation Report for This Property
The Home Valuation Report is an in-depth analysis detailing your home's value as well as a comparison with similar homes in the area
Home Values in the Area
Average Home Value in this Area
Purchase History
| Date | Buyer | Sale Price | Title Company |
|---|---|---|---|
| Sarco & Associations Llc | $140,000 | None Available | |
| Coastal Home Rentals 10 Llc | -- | None Available | |
| Coastal Home Rentals Llc | $89,500 | None Available | |
| Wilson Charless J | -- | None Available | |
| Jordan C L Trustee | -- | -- | |
| Wilson Charleene J | $44,000 | -- | |
| Stroud Cheryl Ann | -- | -- | |
| Stroud Ann | $41,000 | -- | |
| Park Place Associates | -- | -- |
Source: Public Records
Tax History Compared to Growth
Tax History
| Year | Tax Paid | Tax Assessment Tax Assessment Total Assessment is a certain percentage of the fair market value that is determined by local assessors to be the total taxable value of land and additions on the property. | Land | Improvement |
|---|---|---|---|---|
| 2025 | $1,101 | $220,700 | $0 | $220,700 |
| 2024 | $1,101 | $126,600 | $0 | $126,600 |
| 2023 | $1,101 | $126,600 | $0 | $126,600 |
| 2022 | $1,076 | $126,600 | $0 | $126,600 |
| 2021 | $1,083 | $126,600 | $0 | $126,600 |
| 2020 | $744 | $70,600 | $0 | $70,600 |
| 2019 | $744 | $70,600 | $0 | $70,600 |
| 2018 | $0 | $70,600 | $0 | $70,600 |
| 2017 | $744 | $70,600 | $0 | $70,600 |
| 2016 | $835 | $75,400 | $0 | $75,400 |
| 2015 | $798 | $75,400 | $0 | $75,400 |
| 2014 | $765 | $75,400 | $0 | $75,400 |
Source: Public Records
Map
Nearby Homes
- 3624 Saint Johns Ct Unit B
- 3605 Saint Johns Ct Unit B
- 3735 Saint Johns Ct Unit B
- 1018 Birch Creek Dr
- 3538 Wilshire Blvd
- 3525 Wilshire Blvd
- 935 Birch Creek Dr Unit 27
- 1044 Page Ave
- 1020 Page Ave
- 2918 Park Ave
- 708 Rosemont Ave
- 1103 Forest Hills Dr
- 2821 Park Ave
- 907 Bonham Ave
- 2817 Park Ave
- 4011 Peachtree Ave
- 2811 Oleander Dr
- 2940 Oleander Dr Unit A5
- 2940 Oleander Dr Unit F11
- 2940 Oleander Dr Unit C9
- 3633 Saint Johns Ct
- 3639 Saint Johns Ct
- 3637 Saint Johns Ct Unit 37b
- 3633 Saint Johns Ct Unit 33A
- 3639B Saint Johns Ct Unit 39B
- 3639A Saint Johns Ct
- 3637 Saint Johns Ct
- 3639 Saint Johns Ct Unit 39a
- 3633 Saint Johns Ct Unit A
- 3633 Saint Johns Ct Unit B
- 3637 Saint Johns Ct Unit A
- 3633 Saint Johns Ct Unit A
- 3639 Saint Johns Ct Unit B
- 3633 Saint Johns Ct Unit 33A
- 3633 Saint Johns Ct Unit 33b
- 3637 Saint Johns Ct Unit B
- 3637 Saint Johns Ct Unit A
- 3635 Saint Johns Ct
- 3633 Saint Johns Ct
- 3643A Saint Johns Ct