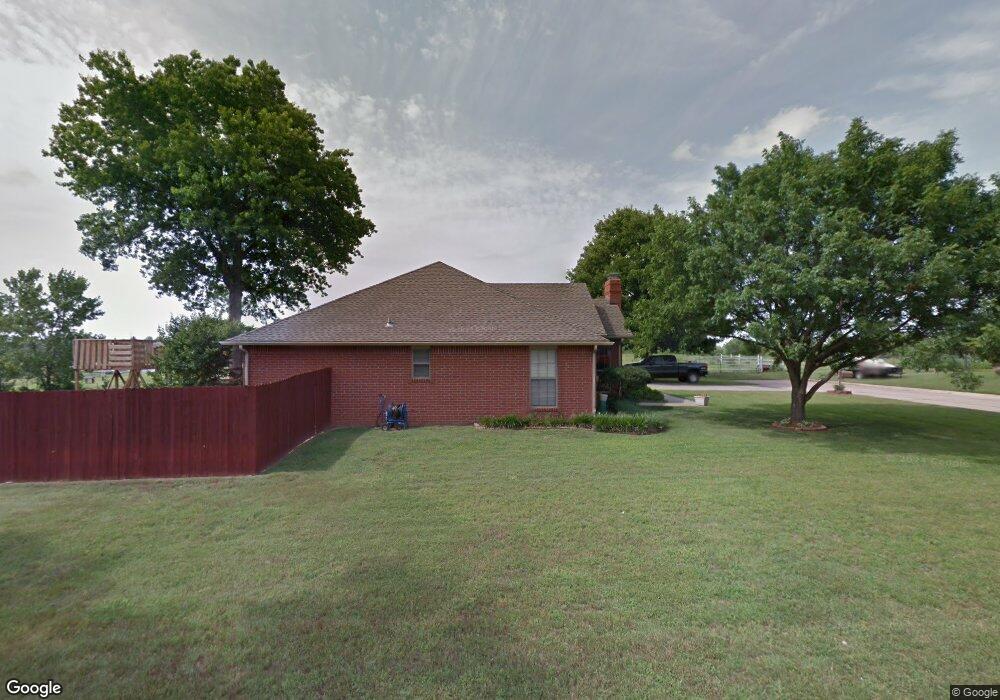
3637 Wellington Rd Ponca City, OK 74604
Estimated Value: $232,440 - $276,000
3
Beds
2
Baths
1,852
Sq Ft
$135/Sq Ft
Est. Value
About This Home
This home is located at 3637 Wellington Rd, Ponca City, OK 74604 and is currently estimated at $250,610, approximately $135 per square foot. 3637 Wellington Rd is a home located in Kay County with nearby schools including E.M. Trout Elementary School, Ponca City East Middle School, and Ponca City West Middle School.
Ownership History
Date
Name
Owned For
Owner Type
Purchase Details
Closed on
Oct 29, 2009
Sold by
Brookfield Global Relocation Services Ll
Bought by
Brewer Chancelor B and Smith Angela N
Current Estimated Value
Home Financials for this Owner
Home Financials are based on the most recent Mortgage that was taken out on this home.
Original Mortgage
$170,838
Outstanding Balance
$107,520
Interest Rate
5.05%
Mortgage Type
FHA
Estimated Equity
$143,090
Purchase Details
Closed on
Aug 20, 2009
Sold by
Thompson James C and Thompson Carol J
Bought by
Brookfield Global Relocation Services Ll and Gmac Global Relocation Services Llc
Purchase Details
Closed on
Dec 31, 2002
Sold by
Gmac Global Relocation
Bought by
Carol James and Carol Thompsen
Purchase Details
Closed on
Jun 15, 1998
Sold by
Marlies Trent and Marlies Brown
Bought by
Thomas and Danielson M
Create a Home Valuation Report for This Property
The Home Valuation Report is an in-depth analysis detailing your home's value as well as a comparison with similar homes in the area
Home Values in the Area
Average Home Value in this Area
Purchase History
| Date | Buyer | Sale Price | Title Company |
|---|---|---|---|
| Brewer Chancelor B | $174,000 | -- | |
| Brewer Chance | -- | -- | |
| Brookfield Global Relocation Services Ll | $174,000 | -- | |
| Carol James | $153,500 | -- | |
| Gmac Global Relocation | $153,500 | -- | |
| Thomas | $128,000 | -- |
Source: Public Records
Mortgage History
| Date | Status | Borrower | Loan Amount |
|---|---|---|---|
| Open | Brewer Chancelor B | $170,838 |
Source: Public Records
Tax History Compared to Growth
Tax History
| Year | Tax Paid | Tax Assessment Tax Assessment Total Assessment is a certain percentage of the fair market value that is determined by local assessors to be the total taxable value of land and additions on the property. | Land | Improvement |
|---|---|---|---|---|
| 2024 | $1,711 | $19,076 | $2,019 | $17,057 |
| 2023 | $1,711 | $18,520 | $2,010 | $16,510 |
| 2022 | $1,667 | $18,520 | $2,010 | $16,510 |
| 2021 | $1,676 | $18,520 | $2,010 | $16,510 |
| 2020 | $1,628 | $18,200 | $1,986 | $16,214 |
| 2019 | $1,593 | $17,671 | $2,010 | $15,661 |
| 2018 | $1,564 | $17,156 | $1,850 | $15,306 |
| 2017 | $1,623 | $17,558 | $1,850 | $15,708 |
| 2016 | $1,660 | $17,760 | $1,850 | $15,910 |
| 2015 | $1,616 | $17,247 | $1,850 | $15,397 |
| 2014 | $1,564 | $17,027 | $1,682 | $15,345 |
Source: Public Records
Map
Nearby Homes
- 2200 Chapel Hill Rd
- 2602 Ridgecrest
- 3205 Kingston Rd
- 1704 Fairway Place
- 3013 Kingston Rd
- 3019 Meadow Ln
- 3602 N 14th
- 1413 Crawford Ave
- 2612 Meadow Ln
- 7525 E Prospect Ave
- 211 E Prospect Ave
- 1150 E Prospect Ave
- 2607 Bluestem Rd
- Tr. 7, 4000 Blk E Hubbard Rd
- Tr. 6, 4000 Blk E Hubbard Rd
- Tr. 5, 4000 Blk E Hubbard Rd
- Tr. 4, 4000 Blk E Hubbard Rd
- Tr. 3, 4000 Blk E Hubbard Rd
- 2216 El Camino St
- 2211 Turner St
- 3633 Wellington Rd
- 3628 Wellington Rd
- 3624 Wellington Rd
- 3629 Wellington Rd
- 3620 Wellington Rd
- 3625 Wellington Rd
- 3609 Nottingham Cir
- 3616 Wellington Rd
- 3613 Nottingham Cir
- 3612 Wellington Rd
- 3605 Nottingham Cir
- 3617 Nottingham Cir
- 3621 Wellington Rd
- 3608 Wellington Rd
- 2301 Briar Ridge Rd
- 2305 Briar Ridge Rd
- 3601 Nottingham Cir
- 3621 Nottingham Cir
- 3613 Wellington Rd
- 3604 Wellington Rd