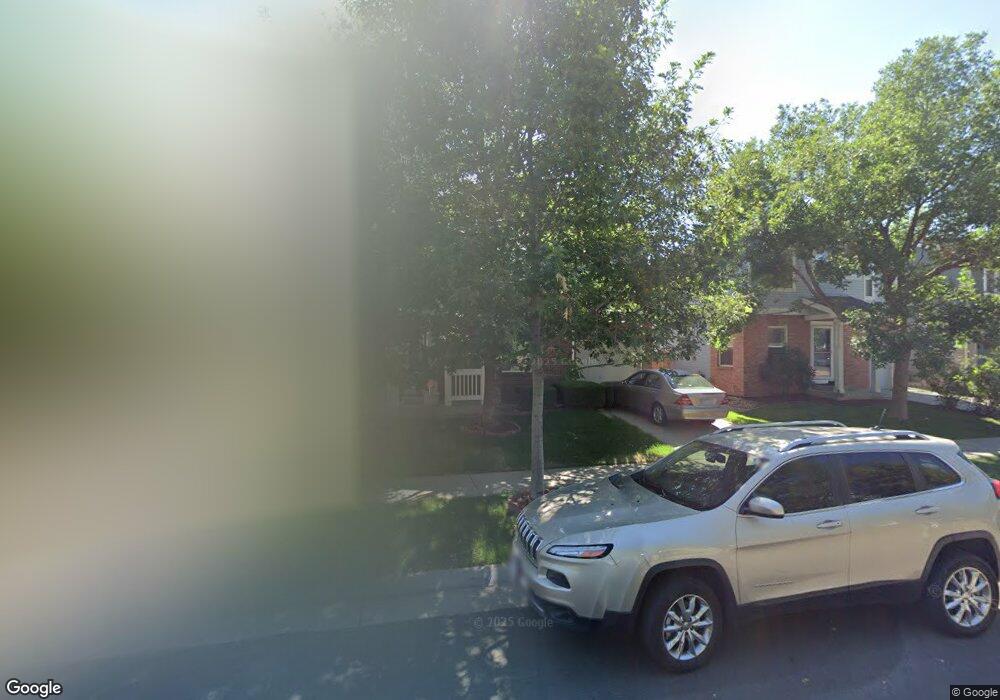
3638 Dexter Ct Denver, CO 80207
Northeast Park Hill NeighborhoodEstimated Value: $559,390 - $592,000
3
Beds
2
Baths
1,466
Sq Ft
$397/Sq Ft
Est. Value
About This Home
This home is located at 3638 Dexter Ct, Denver, CO 80207 and is currently estimated at $581,348, approximately $396 per square foot. 3638 Dexter Ct is a home located in Denver County with nearby schools including Margaret M Smith Elementary School, William (Bill) Roberts ECE-8 School, and McAuliffe International School.
Ownership History
Date
Name
Owned For
Owner Type
Purchase Details
Closed on
Aug 11, 2017
Sold by
Gardea Adrian
Bought by
Vaughn Darla K
Current Estimated Value
Home Financials for this Owner
Home Financials are based on the most recent Mortgage that was taken out on this home.
Original Mortgage
$375,081
Outstanding Balance
$309,263
Interest Rate
3.88%
Mortgage Type
FHA
Estimated Equity
$272,085
Purchase Details
Closed on
Apr 26, 2013
Sold by
Rubio Dawn Marie
Bought by
Gardea Adrian
Home Financials for this Owner
Home Financials are based on the most recent Mortgage that was taken out on this home.
Original Mortgage
$196,377
Interest Rate
3.37%
Mortgage Type
FHA
Purchase Details
Closed on
Jan 30, 2002
Sold by
Kb Home Colorado Inc
Bought by
Rubio Dawn Marie
Home Financials for this Owner
Home Financials are based on the most recent Mortgage that was taken out on this home.
Original Mortgage
$180,600
Interest Rate
7.15%
Create a Home Valuation Report for This Property
The Home Valuation Report is an in-depth analysis detailing your home's value as well as a comparison with similar homes in the area
Home Values in the Area
Average Home Value in this Area
Purchase History
| Date | Buyer | Sale Price | Title Company |
|---|---|---|---|
| Vaughn Darla K | $382,000 | Heritage Title Co | |
| Gardea Adrian | $200,000 | Land Title Guarantee Company | |
| Rubio Dawn Marie | $190,172 | -- |
Source: Public Records
Mortgage History
| Date | Status | Borrower | Loan Amount |
|---|---|---|---|
| Open | Vaughn Darla K | $375,081 | |
| Previous Owner | Gardea Adrian | $196,377 | |
| Previous Owner | Rubio Dawn Marie | $180,600 |
Source: Public Records
Tax History
| Year | Tax Paid | Tax Assessment Tax Assessment Total Assessment is a certain percentage of the fair market value that is determined by local assessors to be the total taxable value of land and additions on the property. | Land | Improvement |
|---|---|---|---|---|
| 2025 | $2,911 | $40,360 | $6,650 | $6,650 |
| 2024 | $2,911 | $36,750 | $2,630 | $34,120 |
| 2023 | $2,848 | $36,750 | $2,630 | $34,120 |
| 2022 | $2,467 | $31,020 | $5,460 | $25,560 |
| 2021 | $2,381 | $31,910 | $5,620 | $26,290 |
| 2020 | $2,109 | $28,420 | $5,620 | $22,800 |
| 2019 | $2,050 | $28,420 | $5,620 | $22,800 |
| 2018 | $1,510 | $19,520 | $3,400 | $16,120 |
| 2017 | $1,506 | $19,520 | $3,400 | $16,120 |
| 2016 | $1,451 | $17,790 | $3,502 | $14,288 |
| 2015 | $1,390 | $17,790 | $3,502 | $14,288 |
| 2014 | $1,067 | $12,850 | $2,786 | $10,064 |
Source: Public Records
Map
Nearby Homes
- 3637 Dexter Ct
- 3708 Dexter Ct
- 3729 Dahlia St
- 3643 Dexter St
- 3797 Dexter Ct
- 3640 Fairfax St
- 3653 Forest St
- 3335 Dexter St
- 3693 Forest St
- 3531 Forest St
- 5085 - 5087 E 34th Ave
- 3532 Forest St
- 5160 E 33rd Ave
- 3440 Albion St
- 3590 Grape St Unit 1
- 3590 Grape St Unit 2
- 3690 Grape St
- 3411 N Albion St Unit 4-1
- 3099 Elm St
- 3070 Cherry St
Your Personal Tour Guide
Ask me questions while you tour the home.