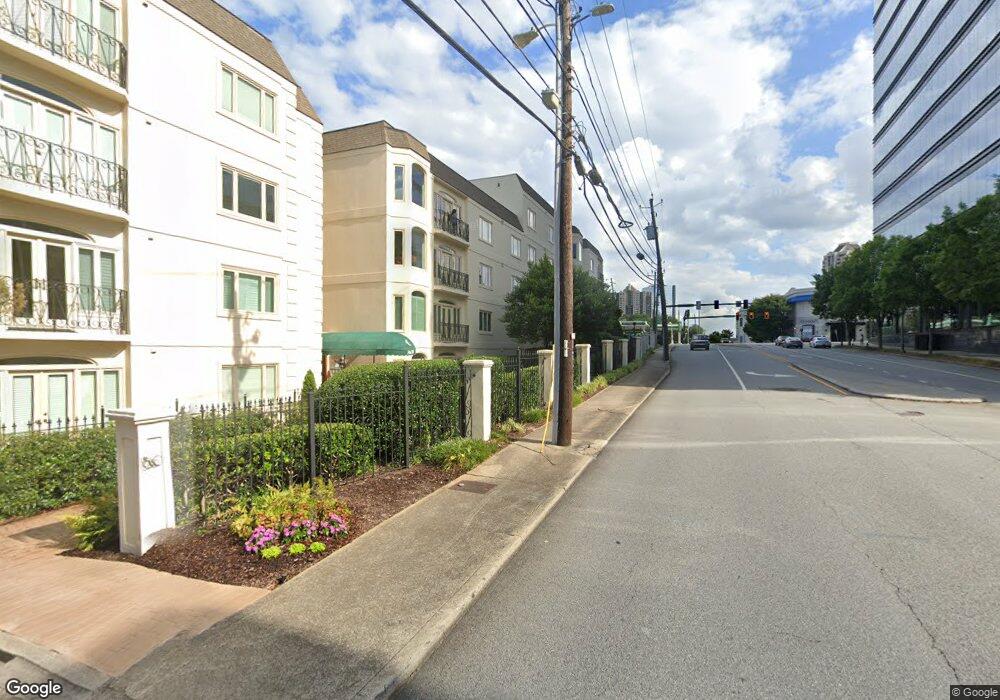
3638 Peachtree Rd NE Unit 202 Atlanta, GA 30319
Historic Brookhaven NeighborhoodEstimated Value: $382,000 - $492,383
2
Beds
2
Baths
1,685
Sq Ft
$270/Sq Ft
Est. Value
About This Home
This home is located at 3638 Peachtree Rd NE Unit 202, Atlanta, GA 30319 and is currently estimated at $455,346, approximately $270 per square foot. 3638 Peachtree Rd NE Unit 202 is a home located in Fulton County with nearby schools including Smith Elementary School, Sutton Middle School, and North Atlanta High School.
Ownership History
Date
Name
Owned For
Owner Type
Purchase Details
Closed on
Dec 30, 2016
Sold by
Stovall Betty T
Bought by
Stovall John S
Current Estimated Value
Purchase Details
Closed on
Sep 6, 2011
Sold by
Stovall Betty Taylor
Bought by
Stovall James Frank and Kendall Virginia Stovall
Purchase Details
Closed on
Oct 31, 1997
Sold by
Stovall Betty T
Bought by
Stovall J Frank
Purchase Details
Closed on
Nov 12, 1993
Sold by
King Billie Jean
Bought by
Hudson Robert J Betti C
Home Financials for this Owner
Home Financials are based on the most recent Mortgage that was taken out on this home.
Original Mortgage
$92,400
Interest Rate
7.14%
Purchase Details
Closed on
Sep 27, 1993
Sold by
Kessler Richard C
Bought by
Kessler Martha W
Home Financials for this Owner
Home Financials are based on the most recent Mortgage that was taken out on this home.
Original Mortgage
$92,400
Interest Rate
7.14%
Purchase Details
Closed on
Dec 22, 1992
Sold by
Shepherd J Harold
Bought by
Shepherd Dana J
Purchase Details
Closed on
Nov 24, 1992
Sold by
Shepherd J Harold
Bought by
Shepherd Alana S
Create a Home Valuation Report for This Property
The Home Valuation Report is an in-depth analysis detailing your home's value as well as a comparison with similar homes in the area
Home Values in the Area
Average Home Value in this Area
Purchase History
| Date | Buyer | Sale Price | Title Company |
|---|---|---|---|
| Stovall John S | $32,313 | -- | |
| Stovall James Frank | -- | -- | |
| Stovall J Frank | $89,300 | -- | |
| Stovall Betty J | $89,300 | -- | |
| Hudson Robert J Betti C | $132,000 | -- | |
| Kessler Martha W | $31,200 | -- | |
| Shepherd Dana J | $19,000 | -- | |
| Shepherd Alana S | $59,800 | -- |
Source: Public Records
Mortgage History
| Date | Status | Borrower | Loan Amount |
|---|---|---|---|
| Previous Owner | Hudson Robert J Betti C | $92,400 |
Source: Public Records
Tax History Compared to Growth
Tax History
| Year | Tax Paid | Tax Assessment Tax Assessment Total Assessment is a certain percentage of the fair market value that is determined by local assessors to be the total taxable value of land and additions on the property. | Land | Improvement |
|---|---|---|---|---|
| 2025 | $4,951 | $169,240 | $28,720 | $140,520 |
| 2023 | $6,425 | $155,200 | $20,160 | $135,040 |
| 2022 | $5,750 | $142,080 | $25,160 | $116,920 |
| 2021 | $4,689 | $115,760 | $19,560 | $96,200 |
| 2020 | $4,687 | $114,400 | $19,360 | $95,040 |
| 2019 | $341 | $147,880 | $17,760 | $130,120 |
| 2018 | $5,978 | $144,400 | $17,320 | $127,080 |
| 2017 | $4,255 | $98,520 | $16,680 | $81,840 |
| 2016 | $4,266 | $98,520 | $16,680 | $81,840 |
| 2015 | $4,387 | $98,520 | $16,680 | $81,840 |
| 2014 | $4,467 | $98,520 | $16,680 | $81,840 |
Source: Public Records
Map
Nearby Homes
- 3630 Peachtree Rd NE Unit 2404
- 3630 Peachtree Rd NE Unit 2104
- 3630 Peachtree Rd NE Unit 3106
- 3630 Peachtree Rd NE Unit 2106
- 3630 Peachtree Rd NE Unit 2009
- 3630 Peachtree Rd NE Unit 2102
- 3630 Peachtree Rd NE Unit 2005
- 3630 Peachtree Rd NE Unit 1909
- 3630 Peachtree Rd NE Unit 2706
- 3630 Peachtree Rd NE Unit 2309
- 3630 Peachtree Rd NE Unit 3207
- 3630 Peachtree Rd NE Unit PH-3401
- 3630 Peachtree Rd NE Unit 2207
- 3648 Peachtree Rd Unit 4S
- 3649 Peachtree Rd NE Unit 305
- 3655 Peachtree Rd NE Unit 304
- 3655 Peachtree Rd NE Unit 401
- 3660 Peachtree Rd NE Unit 2H
- 3660 Peachtree Rd NE Unit 6
- 3660 Peachtree Rd NE Unit 5
- 3638 Peachtree Rd NE Unit 206
- 3638 Peachtree Rd NE Unit 406
- 3638 Peachtree Rd NE Unit 404
- 3638 Peachtree Rd NE Unit 402
- 3638 Peachtree Rd NE Unit 306
- 3638 Peachtree Rd NE Unit 302
- 3638 Peachtree Rd NE Unit 206
- 3638 Peachtree Rd NE Unit 204
- 3638 Peachtree Rd NE Unit 106
- 3638 Peachtree Rd NE Unit 104
- 3638 Peachtree Rd NE Unit 102
- 3638 Peachtree Rd NE
- 3638 Peachtree Rd NE
- 3636 Peachtree Rd NE Unit 205
- 3636 Peachtree Rd NE Unit 405
- 3636 Peachtree Rd NE Unit 403
- 3636 Peachtree Rd NE Unit 401
- 3636 Peachtree Rd NE Unit 305
- 3636 Peachtree Rd NE Unit 303
- 3636 Peachtree Rd NE Unit 301