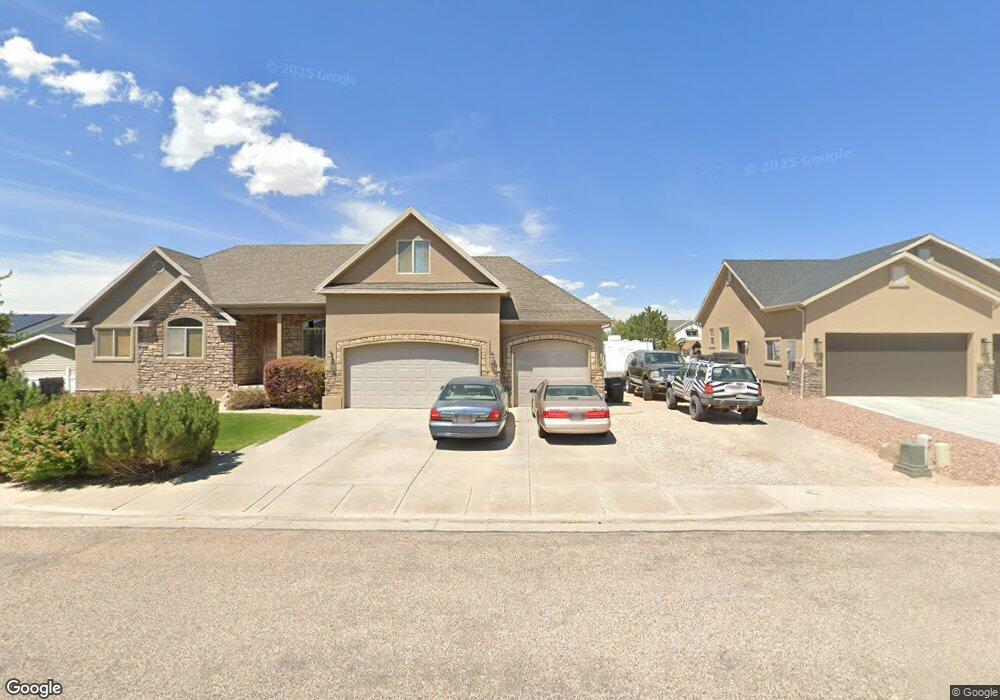
3638 W 1350 N Unit Lot 5 Cedar City, UT 84721
Estimated Value: $520,923 - $572,000
5
Beds
3
Baths
3,838
Sq Ft
$143/Sq Ft
Est. Value
About This Home
This home is located at 3638 W 1350 N Unit Lot 5, Cedar City, UT 84721 and is currently estimated at $547,481, approximately $142 per square foot. 3638 W 1350 N Unit Lot 5 is a home located in Iron County with nearby schools including Iron Springs School, Cedar Middle School, and Cedar City High School.
Ownership History
Date
Name
Owned For
Owner Type
Purchase Details
Closed on
Dec 12, 2023
Sold by
Groves Kristilee
Bought by
Groves William B
Current Estimated Value
Purchase Details
Closed on
Oct 11, 2007
Sold by
Burke Robert C and Burke Kathy J
Bought by
Burke Robert C and Burke Kathy J
Home Financials for this Owner
Home Financials are based on the most recent Mortgage that was taken out on this home.
Original Mortgage
$272,000
Interest Rate
6.42%
Mortgage Type
New Conventional
Purchase Details
Closed on
Dec 26, 2006
Sold by
Pride Land Homes & Construction Inc
Bought by
Burke Robert C and Burke Kathy W
Purchase Details
Closed on
Apr 18, 2005
Sold by
Equestrian Pointe Land Co Llc
Bought by
Pride Land Homes And Construction Inc
Create a Home Valuation Report for This Property
The Home Valuation Report is an in-depth analysis detailing your home's value as well as a comparison with similar homes in the area
Home Values in the Area
Average Home Value in this Area
Purchase History
| Date | Buyer | Sale Price | Title Company |
|---|---|---|---|
| Groves William B | -- | None Listed On Document | |
| Burke Robert C | -- | -- | |
| Burke Robert C | -- | -- | |
| Pride Land Homes And Construction Inc | -- | Cedar Land Title Inc |
Source: Public Records
Mortgage History
| Date | Status | Borrower | Loan Amount |
|---|---|---|---|
| Previous Owner | Burke Robert C | $272,000 |
Source: Public Records
Tax History Compared to Growth
Tax History
| Year | Tax Paid | Tax Assessment Tax Assessment Total Assessment is a certain percentage of the fair market value that is determined by local assessors to be the total taxable value of land and additions on the property. | Land | Improvement |
|---|---|---|---|---|
| 2025 | $2,289 | $294,330 | $45,403 | $248,927 |
| 2024 | $2,274 | $292,305 | $45,405 | $246,900 |
| 2023 | $2,274 | $279,410 | $48,505 | $230,905 |
| 2022 | $2,438 | $265,215 | $40,420 | $224,795 |
| 2021 | $1,915 | $208,285 | $20,960 | $187,325 |
| 2020 | $1,899 | $183,160 | $20,960 | $162,200 |
| 2019 | $1,756 | $162,000 | $20,960 | $141,040 |
| 2018 | $1,643 | $146,590 | $18,365 | $128,225 |
| 2017 | $1,573 | $138,205 | $18,365 | $119,840 |
| 2016 | $1,590 | $130,125 | $15,995 | $114,130 |
| 2015 | $1,609 | $124,860 | $0 | $0 |
| 2014 | $1,499 | $108,815 | $0 | $0 |
Source: Public Records
Map
Nearby Homes
- 7374 N 3625 West Cir
- 6903 N 3625 Cir W Unit 3
- 6903 N 3625 Cir W
- 5513 N 3575 W
- 5513 N 3575 W Unit Lot. 3 Block CF, Ced
- 6800 N 3700 W
- 5695 N 3525 Cir W
- 6151 N 3800 W
- 6116 N 3800 W
- 1503 N 3700 W
- 3846 W 1225 N
- 3853 W 1300 N
- 3854 W 1500 N
- 3437 W 1600 N
- 1148 Yucca St
- 1170 N Yucca St
- 1 AC Ft Water Right 73-3911 Unit No. of Hwy 56
- 1 ac ft 73-4733 Unit 6.33 ac ft avaliable
- 1148 N Yucca St
- 1031 N Fern St
- 3638 W 1350 N
- 3633 W 1375 N
- 3652 W 1350 N
- 3628 W 1350 N
- 3645 W 1350 N
- 3645 W 1350 N Unit 10
- 1337 N 3625 W
- 3657 W 1375 N
- 3609 W 1375 N
- 3659 W 1350 N
- 3668 W 1350 N
- 1352 N 3625 W
- 3685 W 1350 N
- 3618 1375 St N Unit 5
- 0 1375 St N Unit 8
- 3618 1375 St N
- 3985 1375 St N
- 3671 W 1350 N
- 1296 N 3625 Cir W
- 3681 W 1375 N