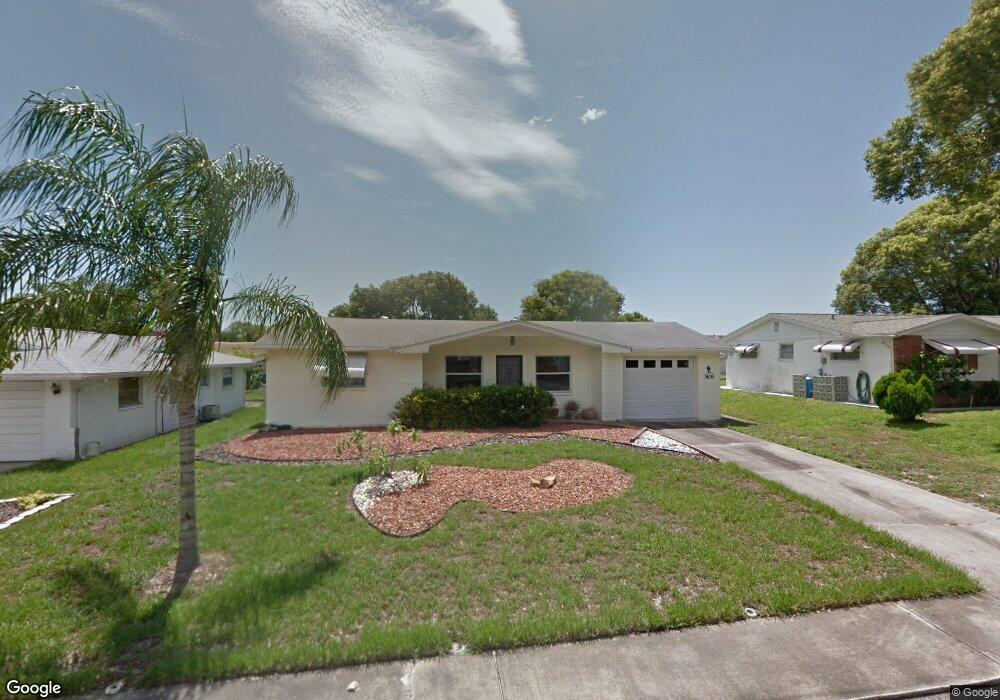
3639 Blackhawk Dr New Port Richey, FL 34652
Estimated Value: $215,000 - $290,000
2
Beds
2
Baths
1,566
Sq Ft
$157/Sq Ft
Est. Value
About This Home
This home is located at 3639 Blackhawk Dr, New Port Richey, FL 34652 and is currently estimated at $245,686, approximately $156 per square foot. 3639 Blackhawk Dr is a home located in Pasco County with nearby schools including Anclote Elementary School, Gulf Middle School, and Gulf High School.
Ownership History
Date
Name
Owned For
Owner Type
Purchase Details
Closed on
Apr 21, 2021
Sold by
Ad2 Capital Llc
Bought by
Redevelopment Capital Services Llc
Current Estimated Value
Purchase Details
Closed on
Apr 22, 2020
Sold by
Yeargan Renee M
Bought by
Ad2 Capital Llc
Purchase Details
Closed on
Mar 3, 2015
Sold by
Hyman Larry S and Yeargan Renee Marie
Bought by
Black Point Assets Inc
Purchase Details
Closed on
Jan 6, 2003
Sold by
Duarte Peter and Duarte Miryam
Bought by
Yeargan Renee M
Home Financials for this Owner
Home Financials are based on the most recent Mortgage that was taken out on this home.
Original Mortgage
$72,856
Interest Rate
6.1%
Mortgage Type
FHA
Purchase Details
Closed on
May 14, 1999
Sold by
Rampacek John J and Rampacek Marjorie R
Bought by
Duarte Peter and Duarte Miryam
Home Financials for this Owner
Home Financials are based on the most recent Mortgage that was taken out on this home.
Original Mortgage
$48,364
Interest Rate
6.98%
Mortgage Type
FHA
Create a Home Valuation Report for This Property
The Home Valuation Report is an in-depth analysis detailing your home's value as well as a comparison with similar homes in the area
Home Values in the Area
Average Home Value in this Area
Purchase History
| Date | Buyer | Sale Price | Title Company |
|---|---|---|---|
| Redevelopment Capital Services Llc | $277,700 | Accommodation | |
| Redevelopment Cap Services Llc | $277,700 | None Listed On Document | |
| Ad2 Capital Llc | $90,400 | None Available | |
| Black Point Assets Inc | $88,800 | None Available | |
| Yeargan Renee M | $74,000 | Multiple | |
| Duarte Peter | $47,900 | -- |
Source: Public Records
Mortgage History
| Date | Status | Borrower | Loan Amount |
|---|---|---|---|
| Previous Owner | Yeargan Renee M | $72,856 | |
| Previous Owner | Duarte Peter | $48,364 |
Source: Public Records
Tax History Compared to Growth
Tax History
| Year | Tax Paid | Tax Assessment Tax Assessment Total Assessment is a certain percentage of the fair market value that is determined by local assessors to be the total taxable value of land and additions on the property. | Land | Improvement |
|---|---|---|---|---|
| 2025 | $3,042 | $174,713 | $38,495 | $136,218 |
| 2024 | $3,042 | $183,518 | $36,067 | $147,451 |
| 2023 | $2,814 | $141,350 | $0 | $0 |
| 2022 | $2,232 | $128,506 | $24,045 | $104,461 |
| 2021 | $1,993 | $111,917 | $19,074 | $92,843 |
| 2020 | $1,550 | $88,760 | $12,311 | $76,449 |
| 2019 | $1,470 | $88,310 | $12,311 | $75,999 |
| 2018 | $1,322 | $75,139 | $12,311 | $62,828 |
| 2017 | $1,209 | $63,416 | $12,311 | $51,105 |
| 2016 | $1,070 | $54,668 | $12,311 | $42,357 |
| 2015 | $458 | $42,793 | $0 | $0 |
| 2014 | $438 | $42,453 | $11,560 | $30,893 |
Source: Public Records
Map
Nearby Homes
- 3633 Blackhawk Dr
- 5714 Marble Dr
- 5642 Dove Dr
- 3547 Odom Dr Unit 20
- 3735 Mynabird Dr
- 3802 Mynabird Dr
- 5608 Perkin Dr
- 5703 Andrea Dr
- 3841 Chaffey Dr
- 5543 Moog Rd
- 0 Grand Blvd
- 3801 Golden Shiner Ln
- 3339 Ocio St
- 6068 Apple Snail Ave
- 0 Sr 54 Dr Unit MFRU8195308
- 3236 Madison St
- 3645 Galway Dr
- 5548 Olympia St
- 3140 Bahia Ave
- 3539 Anniversary Ct
- 3647 Blackhawk Dr
- 3640 Yellowbird Dr
- 3648 Yellowbird Dr
- 3634 Yellowbird Dr
- 3640 Blackhawk Dr
- 3625 Blackhawk Dr
- 3653 Blackhawk Dr
- 3648 Blackhawk Dr
- 3634 Blackhawk Dr
- 3626 Yellowbird Dr
- 3654 Yellowbird Dr
- 3626 Blackhawk Dr
- 3619 Blackhawk Dr
- 3705 Blackhawk Dr
- 5721 Chipper Dr
- 3620 Yellowbird Dr
- 3639 Warbler Dr
- 3706 Yellowbird Dr
- 3647 Warbler Dr
- 3633 Warbler Dr