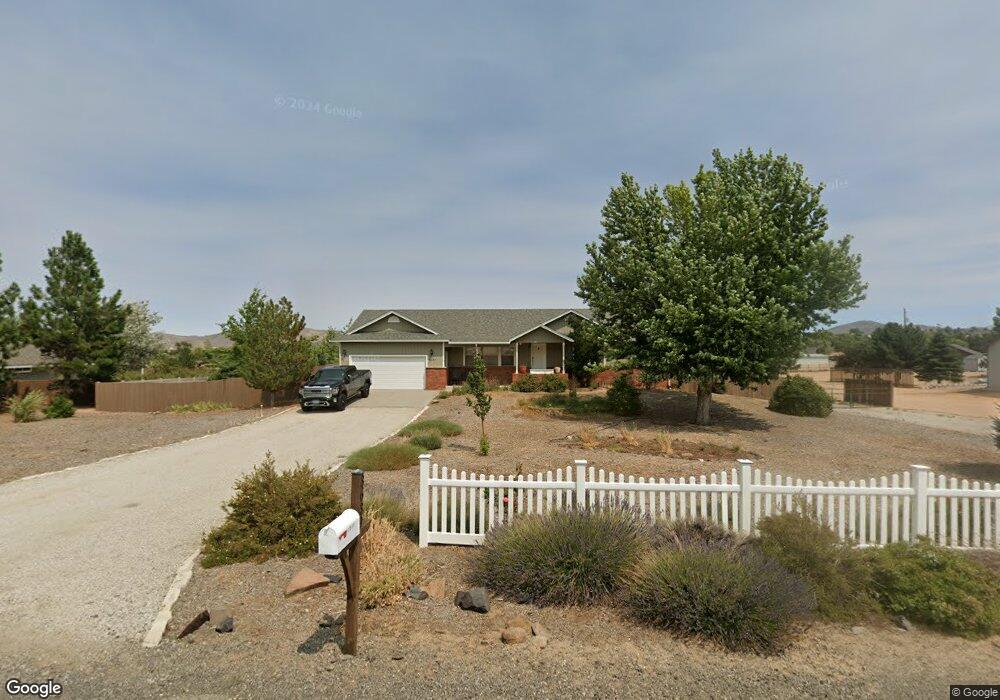
3639 Cindy's Trail Carson City, NV 89705
Estimated Value: $699,446 - $736,000
3
Beds
3
Baths
3,412
Sq Ft
$210/Sq Ft
Est. Value
About This Home
This home is located at 3639 Cindy's Trail, Carson City, NV 89705 and is currently estimated at $716,612, approximately $210 per square foot. 3639 Cindy's Trail is a home located in Douglas County with nearby schools including Jacks Valley Elementary School, Carson Valley Middle School, and Douglas County High School.
Ownership History
Date
Name
Owned For
Owner Type
Purchase Details
Closed on
Aug 24, 2023
Sold by
Brown Family Trust
Bought by
Martin And Linda Holler Living Trust and Holler
Current Estimated Value
Purchase Details
Closed on
Oct 14, 2022
Sold by
Brown Thomas E
Bought by
Brown Family Trust
Purchase Details
Closed on
Jan 13, 2010
Sold by
Stachow Robert P and Stachow Brooke M
Bought by
Brown Thomas E
Home Financials for this Owner
Home Financials are based on the most recent Mortgage that was taken out on this home.
Original Mortgage
$214,311
Interest Rate
4.94%
Mortgage Type
New Conventional
Purchase Details
Closed on
Sep 21, 2005
Sold by
Martineau Nancy Joyce and Martineau James Michael
Bought by
Stachow Robert P and Stachow Brooke M
Home Financials for this Owner
Home Financials are based on the most recent Mortgage that was taken out on this home.
Original Mortgage
$359,600
Interest Rate
5.81%
Mortgage Type
New Conventional
Create a Home Valuation Report for This Property
The Home Valuation Report is an in-depth analysis detailing your home's value as well as a comparison with similar homes in the area
Home Values in the Area
Average Home Value in this Area
Purchase History
| Date | Buyer | Sale Price | Title Company |
|---|---|---|---|
| Martin And Linda Holler Living Trust | $677,500 | Ticor Title | |
| Brown Family Trust | -- | -- | |
| Brown Thomas E | $250,000 | First American Title Min | |
| Stachow Robert P | $449,500 | First American Title Company |
Source: Public Records
Mortgage History
| Date | Status | Borrower | Loan Amount |
|---|---|---|---|
| Previous Owner | Brown Thomas E | $214,311 | |
| Previous Owner | Stachow Robert P | $359,600 |
Source: Public Records
Tax History Compared to Growth
Tax History
| Year | Tax Paid | Tax Assessment Tax Assessment Total Assessment is a certain percentage of the fair market value that is determined by local assessors to be the total taxable value of land and additions on the property. | Land | Improvement |
|---|---|---|---|---|
| 2025 | $2,795 | $133,224 | $61,250 | $71,974 |
| 2024 | $2,795 | $134,087 | $61,250 | $72,837 |
| 2023 | $2,714 | $130,031 | $61,250 | $68,781 |
| 2022 | $2,635 | $115,157 | $50,750 | $64,407 |
| 2021 | $2,559 | $107,701 | $46,200 | $61,501 |
| 2020 | $2,483 | $102,866 | $42,000 | $60,866 |
| 2019 | $2,411 | $101,947 | $42,000 | $59,947 |
| 2018 | $2,340 | $89,522 | $31,500 | $58,022 |
| 2017 | $2,273 | $86,913 | $28,000 | $58,913 |
| 2016 | $2,217 | $75,006 | $22,750 | $52,256 |
| 2015 | $2,005 | $75,006 | $22,750 | $52,256 |
| 2014 | $1,946 | $72,248 | $22,750 | $49,498 |
Source: Public Records
Map
Nearby Homes
- 3662 Cindy's Trail
- 3687 Shawnee Dr
- 534 Headwaters Way
- 46 Boulders Bend Dr Unit 117
- 58 Boulders Bend Dr
- 3423 Golf Club Dr
- APN 1420-06-701-001
- 3540 Tourmaline Ct
- 3482 Calcite Cir
- 3447 Agate Ct
- 0 Old Clear Creek Rd Unit 250001575
- 3532 Haystack Dr
- 3557 Loam Ln
- 3549 Shadow Ln
- 967 Mica Dr
- 5155 Highway 50
- 3522 Smoketree Ave
- 929 Loyola St
- 997 Ridgeview Dr
- 982 Starleaf Ct
- 3639 Cindys Trail
- 3643 Cindys Trail
- 3635 Cindys Trail
- 3649 Cindys Trail
- 3642 Cindys Trail
- 3634 Cindys Trail
- 3615 Cindys Trail
- 3638 Cindys Trail
- 3642 Cindy's Trail
- 3644 Cherokee Dr
- 3648 Cindys Trail
- 3611 Cindy's Trail
- 3618 Cherokee Dr
- 3611 Cindys Trail
- 3655 Cindys Trail
- 3636 Cherokee Dr
- 3636 Cherokee Dr Unit 1
- 3616 Cindys Trail
- 3654 Cindy's Trail
- 3654 Cindys Trail