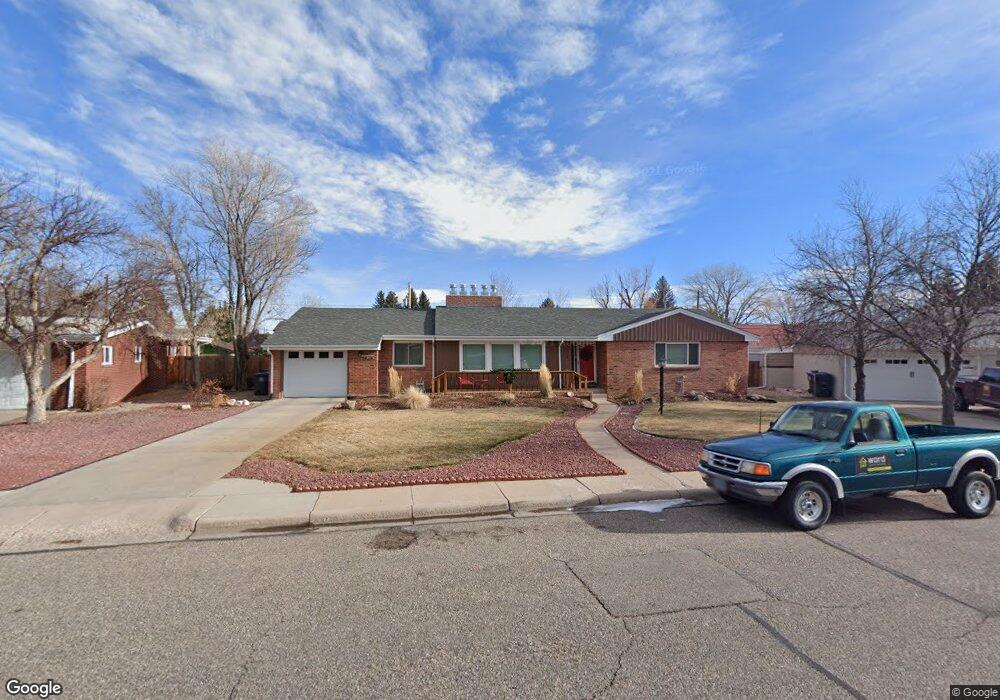
3639 Dover Rd Cheyenne, WY 82001
Estimated Value: $412,000 - $515,000
Studio
1
Bath
2,546
Sq Ft
$184/Sq Ft
Est. Value
About This Home
This home is located at 3639 Dover Rd, Cheyenne, WY 82001 and is currently estimated at $469,292, approximately $184 per square foot. 3639 Dover Rd is a home located in Laramie County with nearby schools including Henderson Elementary School, Carey Junior High School, and East High School.
Ownership History
Date
Name
Owned For
Owner Type
Purchase Details
Closed on
Feb 17, 2016
Sold by
Vanhorn Phillip F and Van Horn Gailene
Bought by
Vanhorn Phillip F and Van Horn Gailene K
Current Estimated Value
Purchase Details
Closed on
Feb 21, 2013
Sold by
Horn Phillip Francis Van
Bought by
Horn Phillip F Van and Horn Gailene Van
Home Financials for this Owner
Home Financials are based on the most recent Mortgage that was taken out on this home.
Original Mortgage
$220,000
Outstanding Balance
$99,517
Interest Rate
3.43%
Mortgage Type
New Conventional
Estimated Equity
$369,775
Purchase Details
Closed on
Apr 22, 2009
Sold by
Vanhorn Phillip F
Bought by
Vanhorn Phillip F and Van Horn Gallene K
Home Financials for this Owner
Home Financials are based on the most recent Mortgage that was taken out on this home.
Original Mortgage
$200,000
Interest Rate
5.14%
Mortgage Type
New Conventional
Purchase Details
Closed on
Apr 14, 1998
Sold by
Vanhorn Phillip F
Bought by
Vanhorn Phillip F and Vanhorn Gailene K
Create a Home Valuation Report for This Property
The Home Valuation Report is an in-depth analysis detailing your home's value as well as a comparison with similar homes in the area
Purchase History
| Date | Buyer | Sale Price | Title Company |
|---|---|---|---|
| Vanhorn Phillip F | -- | None Available | |
| Horn Phillip F Van | -- | None Available | |
| Horn Phillipi Francis Van | -- | None Available | |
| Vanhorn Phillip F | -- | None Available | |
| Vanhorn Phillip F | -- | None Available | |
| Vanhorn Phillip F | -- | -- |
Source: Public Records
Mortgage History
| Date | Status | Borrower | Loan Amount |
|---|---|---|---|
| Open | Horn Phillip F Van | $220,000 | |
| Previous Owner | Vanhorn Phillip F | $200,000 |
Source: Public Records
Tax History
| Year | Tax Paid | Tax Assessment Tax Assessment Total Assessment is a certain percentage of the fair market value that is determined by local assessors to be the total taxable value of land and additions on the property. | Land | Improvement |
|---|---|---|---|---|
| 2025 | $3,330 | $24,099 | $2,846 | $21,253 |
| 2024 | $3,330 | $47,091 | $5,692 | $41,399 |
| 2023 | $3,217 | $45,500 | $5,692 | $39,808 |
| 2022 | $3,092 | $42,833 | $5,692 | $37,141 |
| 2021 | $2,655 | $36,708 | $5,692 | $31,016 |
| 2020 | $2,788 | $38,645 | $5,692 | $32,953 |
| 2019 | $2,638 | $36,537 | $5,692 | $30,845 |
| 2018 | $2,358 | $32,966 | $5,217 | $27,749 |
| 2017 | $2,348 | $32,532 | $5,217 | $27,315 |
| 2016 | $2,211 | $30,624 | $4,905 | $25,719 |
| 2015 | $2,045 | $28,317 | $4,905 | $23,412 |
| 2014 | $1,901 | $26,155 | $4,905 | $21,250 |
Source: Public Records
Map
Nearby Homes
- 3520 Essex Rd
- 3695 Dover Rd
- 3700 Essex Rd
- 1763 Milton Dr
- 2004 E 22nd St
- 1920 E 22nd St
- 1911 E 22nd St
- 1906 E 21st St
- 2533 Deming Blvd
- 2111 Garrett St
- 1841 Crook Ave
- TBD Charles St
- Lot 1 E Phipps Ave
- 2123 E 18th St
- 3561 Amherst Rd
- 3529 Amherst Rd
- 2007 E 17th St
- 1602 Crook Ave
- 1911 E 17th St
- 2114 Rollins Ave
- 3631 Dover Rd
- 3645 Dover Rd
- 3648 Foxcroft Rd
- 3638 Foxcroft Rd
- 3625 Dover Rd
- 3660 Foxcroft Rd
- 3630 Foxcroft Rd
- 3634 Dover Rd
- 3651 Dover Rd
- 3664 Foxcroft Rd
- 3638 Dover Rd
- 3619 Dover Rd
- 3626 Dover Rd
- 3626 Foxcroft Rd
- 3672 Foxcroft Rd
- 3650 Dover Rd
- 3618 Dover Rd
- 3659 Dover Rd
- 3611 Dover Rd
- 3618 Foxcroft Rd
Your Personal Tour Guide
Ask me questions while you tour the home.