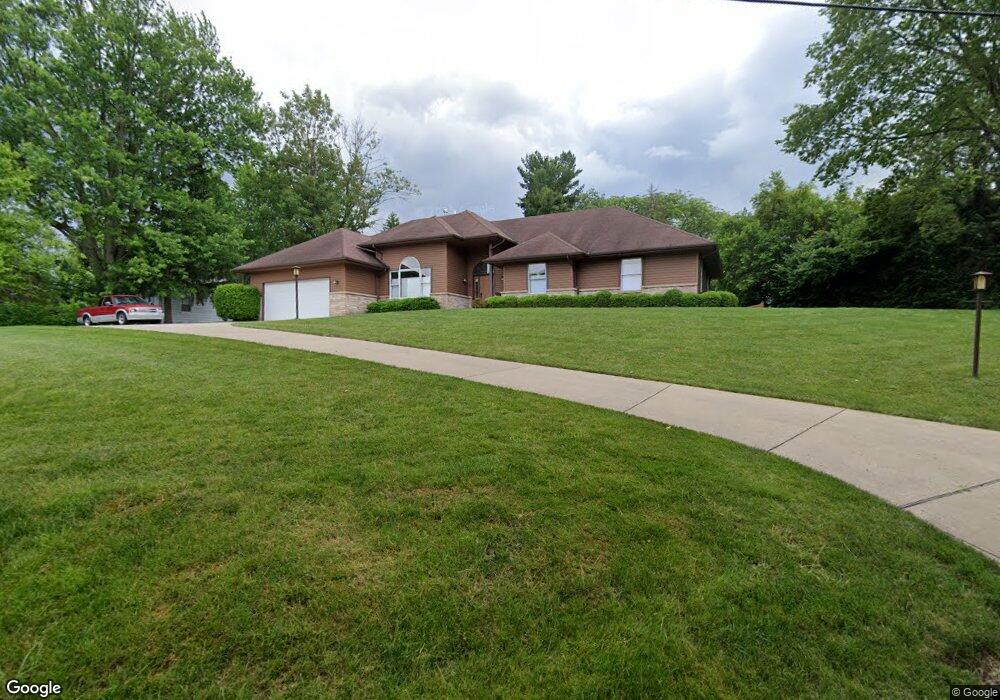
3639 Mockingbird Ln Beavercreek, OH 45430
Estimated Value: $341,085 - $407,000
3
Beds
2
Baths
2,130
Sq Ft
$181/Sq Ft
Est. Value
About This Home
This home is located at 3639 Mockingbird Ln, Beavercreek, OH 45430 and is currently estimated at $386,271, approximately $181 per square foot. 3639 Mockingbird Ln is a home located in Greene County with nearby schools including Fairbrook Elementary School, Herman K Ankeney Middle School, and Beavercreek High School.
Ownership History
Date
Name
Owned For
Owner Type
Purchase Details
Closed on
Dec 22, 2008
Sold by
Brecht Eric B and Brecht Yasuko
Bought by
Zoller Lloyd C and Carpenter Sharon K
Current Estimated Value
Home Financials for this Owner
Home Financials are based on the most recent Mortgage that was taken out on this home.
Original Mortgage
$157,600
Outstanding Balance
$101,033
Interest Rate
5.53%
Mortgage Type
Unknown
Estimated Equity
$285,238
Purchase Details
Closed on
Aug 15, 2003
Sold by
Thorbjornsson Agust S and Thorbjornsson Louella
Bought by
Brecht Eric B and Brecht Yasuko
Home Financials for this Owner
Home Financials are based on the most recent Mortgage that was taken out on this home.
Original Mortgage
$158,400
Interest Rate
5.69%
Mortgage Type
Unknown
Purchase Details
Closed on
Sep 9, 1998
Sold by
Cantrell Clarence E
Bought by
Thorbjornsson Agust S and Thorbjornsson Louella
Create a Home Valuation Report for This Property
The Home Valuation Report is an in-depth analysis detailing your home's value as well as a comparison with similar homes in the area
Home Values in the Area
Average Home Value in this Area
Purchase History
| Date | Buyer | Sale Price | Title Company |
|---|---|---|---|
| Zoller Lloyd C | $197,000 | Attorney | |
| Brecht Eric B | $204,500 | Titlequest Agency Inc | |
| Thorbjornsson Agust S | $32,500 | -- |
Source: Public Records
Mortgage History
| Date | Status | Borrower | Loan Amount |
|---|---|---|---|
| Open | Zoller Lloyd C | $157,600 | |
| Previous Owner | Brecht Eric B | $158,400 | |
| Closed | Brecht Eric B | $29,700 |
Source: Public Records
Tax History Compared to Growth
Tax History
| Year | Tax Paid | Tax Assessment Tax Assessment Total Assessment is a certain percentage of the fair market value that is determined by local assessors to be the total taxable value of land and additions on the property. | Land | Improvement |
|---|---|---|---|---|
| 2024 | $5,739 | $87,910 | $17,350 | $70,560 |
| 2023 | $5,739 | $87,910 | $17,350 | $70,560 |
| 2022 | $5,254 | $71,050 | $10,840 | $60,210 |
| 2021 | $5,148 | $71,050 | $10,840 | $60,210 |
| 2020 | $5,187 | $71,050 | $10,840 | $60,210 |
| 2019 | $5,648 | $70,630 | $10,210 | $60,420 |
| 2018 | $4,985 | $70,630 | $10,210 | $60,420 |
| 2017 | $4,361 | $70,630 | $10,210 | $60,420 |
| 2016 | $4,361 | $59,860 | $10,210 | $49,650 |
| 2015 | $4,335 | $59,860 | $10,210 | $49,650 |
| 2014 | $4,270 | $59,860 | $10,210 | $49,650 |
Source: Public Records
Map
Nearby Homes
- 3682 Echo Hill Ln
- 3597 Echo Hill Ln
- 3534 Sunset Bluff Dr
- 615 Bendwood Way
- 527 Viking Landing Ct
- 3392 Greenburn Rd Unit 3392
- 3961 Ephrata Ct
- 70 Larchmere Dr
- 185 Rosillo Dr
- 684 Newton Dr
- 24 Rosell Dr
- 713 Newton Dr
- 3978 Indian Ripple Rd
- 3667 Creekwood Ct
- 185 Bramblebush Trail
- 97 Apple Blossom Place
- 197 Bramblebush Trail
- 3363 Maplewood Dr
- 149 Chartley Ct
- 3211 Tarleton Dr
- 3631 Roselawn Dr
- 3660 Mockingbird Ln
- 3623 Roselawn Dr
- 3655 Mockingbird Ln
- 3634 Roselawn Dr
- 3669 Roselawn Dr
- 3618 Roselawn Dr
- 3617 Roselawn Dr
- 3670 Mockingbird Ln
- 3671 Mockingbird Ln
- 3674 Roselawn Dr
- 3646 Echo Hill Ln
- 3679 Roselawn Dr
- 3636 Echo Hill Ln
- 3656 Echo Hill Ln
- 3609 Roselawn Dr
- 3628 Echo Hill Ln
- 3681 Mockingbird Ln
- 3664 Echo Hill Ln
- 3674 Echo Hill Ln