Estimated Value: $261,000 - $307,000
4
Beds
3
Baths
2,388
Sq Ft
$119/Sq Ft
Est. Value
About This Home
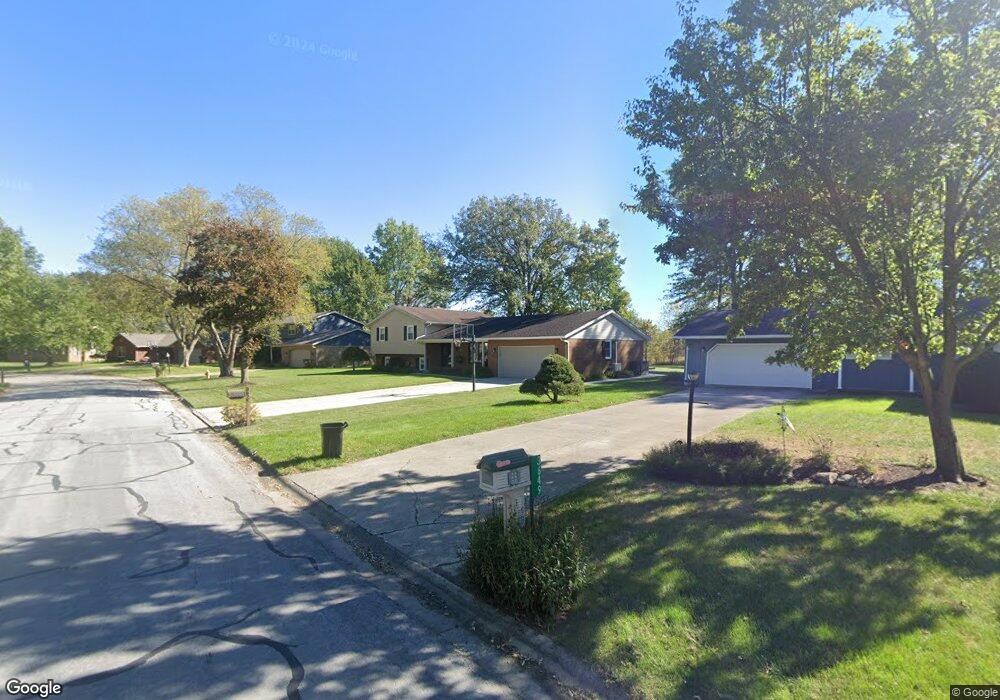
This home is located at 3639 S Amblewood Cir, Lima, OH 45806 and is currently estimated at $284,313, approximately $119 per square foot. 3639 S Amblewood Cir is a home located in Allen County with nearby schools including Maplewood Elementary School, Elmwood Elementary School, and Shawnee Middle School.
Ownership History
Date
Name
Owned For
Owner Type
Purchase Details
Closed on
Jun 20, 2008
Sold by
Chapman Julia Helene
Bought by
Azzarello Anthony M and Azzarello Amy
Current Estimated Value
Home Financials for this Owner
Home Financials are based on the most recent Mortgage that was taken out on this home.
Original Mortgage
$135,300
Outstanding Balance
$86,822
Interest Rate
6.05%
Mortgage Type
Purchase Money Mortgage
Estimated Equity
$197,492
Purchase Details
Closed on
May 12, 2005
Sold by
Chapman James Dean
Bought by
Chapman Julia Helene
Purchase Details
Closed on
Feb 25, 1997
Sold by
Rosebrock David
Bought by
Chapman James and Chapman Julia
Home Financials for this Owner
Home Financials are based on the most recent Mortgage that was taken out on this home.
Original Mortgage
$97,500
Interest Rate
7.92%
Mortgage Type
New Conventional
Purchase Details
Closed on
Feb 1, 1984
Bought by
Rosebrock David L
Create a Home Valuation Report for This Property
The Home Valuation Report is an in-depth analysis detailing your home's value as well as a comparison with similar homes in the area
Home Values in the Area
Average Home Value in this Area
Purchase History
| Date | Buyer | Sale Price | Title Company |
|---|---|---|---|
| Azzarello Anthony M | $169,200 | None Available | |
| Chapman Julia Helene | -- | None Available | |
| Chapman James | $127,500 | -- | |
| Rosebrock David L | $78,000 | -- |
Source: Public Records
Mortgage History
| Date | Status | Borrower | Loan Amount |
|---|---|---|---|
| Open | Azzarello Anthony M | $135,300 | |
| Closed | Chapman James | $97,500 |
Source: Public Records
Tax History Compared to Growth
Tax History
| Year | Tax Paid | Tax Assessment Tax Assessment Total Assessment is a certain percentage of the fair market value that is determined by local assessors to be the total taxable value of land and additions on the property. | Land | Improvement |
|---|---|---|---|---|
| 2024 | $3,992 | $81,450 | $13,690 | $67,760 |
| 2023 | $3,291 | $59,020 | $9,910 | $49,110 |
| 2022 | $3,316 | $59,020 | $9,910 | $49,110 |
| 2021 | $3,313 | $59,020 | $9,910 | $49,110 |
| 2020 | $2,522 | $52,160 | $9,350 | $42,810 |
| 2019 | $2,522 | $52,160 | $9,350 | $42,810 |
| 2018 | $2,461 | $52,160 | $9,350 | $42,810 |
| 2017 | $2,402 | $48,270 | $9,350 | $38,920 |
| 2016 | $2,387 | $48,270 | $9,350 | $38,920 |
| 2015 | $2,511 | $48,270 | $9,350 | $38,920 |
| 2014 | $2,511 | $50,370 | $9,800 | $40,570 |
| 2013 | $2,463 | $50,370 | $9,800 | $40,570 |
Source: Public Records
Map
Nearby Homes
- 3031 Yoakam Rd
- 2227 Seneca Dr
- 4039 Magnolia
- 2632 Alexandria Dr
- 4211 Fort Amanda Rd
- 3220 Fort Amanda Rd
- 3495 Woodhaven Ln
- 3648 Hiawatha Trail
- 2320 London Dr
- 4268 Blue Spruce Ln
- 2975 Zurmehly Rd
- 3523 Woodhaven Ln
- 3680 Yoakam Rd
- 1911 Wonderlick Rd
- 0 Zurmehly Rd
- 4475 Wintergreen Dr
- 2050 Sandy Ln
- 3410 Greens Rd
- 3650 Redbud Ln
- 115 Lanes End