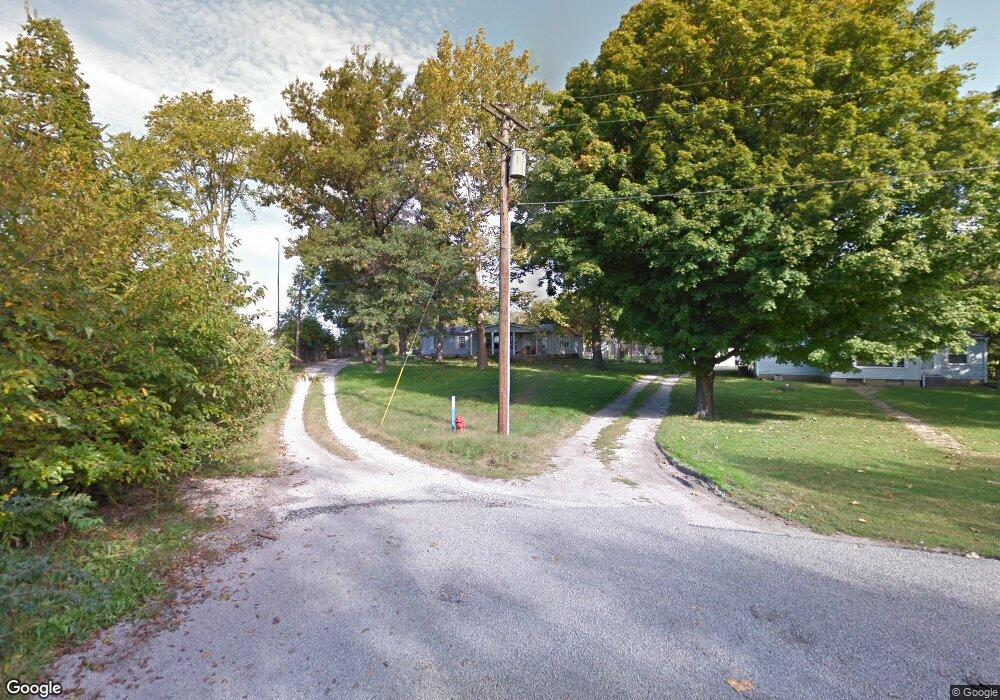
3639 South Grand Ave E Springfield, IL 62712
Estimated Value: $120,000 - $180,963
--
Bed
--
Bath
--
Sq Ft
1.56
Acres
About This Home
This home is located at 3639 South Grand Ave E, Springfield, IL 62712 and is currently estimated at $137,491. 3639 South Grand Ave E is a home located in Sangamon County with nearby schools including Hazel Dell Elementary School, Jefferson Middle School, and Springfield Southeast High School.
Ownership History
Date
Name
Owned For
Owner Type
Purchase Details
Closed on
Aug 1, 2025
Sold by
Burris David
Bought by
Davis Cory
Current Estimated Value
Home Financials for this Owner
Home Financials are based on the most recent Mortgage that was taken out on this home.
Original Mortgage
$116,400
Outstanding Balance
$116,314
Interest Rate
7.5%
Mortgage Type
New Conventional
Estimated Equity
$21,177
Purchase Details
Closed on
Aug 15, 2022
Sold by
Jessayca Hardy
Bought by
Burris David
Home Financials for this Owner
Home Financials are based on the most recent Mortgage that was taken out on this home.
Original Mortgage
$70,000
Interest Rate
5.5%
Mortgage Type
New Conventional
Purchase Details
Closed on
Mar 3, 2016
Purchase Details
Closed on
Sep 25, 2015
Purchase Details
Closed on
Sep 8, 2015
Purchase Details
Closed on
Dec 9, 2014
Purchase Details
Closed on
Oct 18, 2013
Purchase Details
Closed on
Mar 8, 1999
Create a Home Valuation Report for This Property
The Home Valuation Report is an in-depth analysis detailing your home's value as well as a comparison with similar homes in the area
Home Values in the Area
Average Home Value in this Area
Purchase History
| Date | Buyer | Sale Price | Title Company |
|---|---|---|---|
| Davis Cory | $120,000 | None Listed On Document | |
| Burris David | $70,000 | Mills Edwin C | |
| -- | $67,000 | -- | |
| -- | -- | -- | |
| -- | -- | -- | |
| -- | -- | -- | |
| -- | $115,000 | -- | |
| -- | $77,500 | -- |
Source: Public Records
Mortgage History
| Date | Status | Borrower | Loan Amount |
|---|---|---|---|
| Open | Davis Cory | $116,400 | |
| Previous Owner | Burris David | $70,000 |
Source: Public Records
Tax History Compared to Growth
Tax History
| Year | Tax Paid | Tax Assessment Tax Assessment Total Assessment is a certain percentage of the fair market value that is determined by local assessors to be the total taxable value of land and additions on the property. | Land | Improvement |
|---|---|---|---|---|
| 2024 | $2,577 | $30,701 | $6,338 | $24,363 |
| 2023 | $2,475 | $27,814 | $5,742 | $22,072 |
| 2022 | $2,386 | $26,477 | $5,466 | $21,011 |
| 2021 | $1,662 | $24,279 | $5,012 | $19,267 |
| 2020 | $1,608 | $24,139 | $4,983 | $19,156 |
| 2019 | $1,569 | $24,047 | $4,964 | $19,083 |
| 2018 | $1,557 | $24,503 | $5,058 | $19,445 |
| 2017 | $1,988 | $23,757 | $4,904 | $18,853 |
| 2016 | $1,876 | $22,425 | $4,629 | $17,796 |
| 2015 | $1,367 | $22,323 | $4,608 | $17,715 |
| 2014 | $1,411 | $23,046 | $4,757 | $18,289 |
| 2013 | $1,472 | $24,341 | $5,024 | $19,317 |
Source: Public Records
Map
Nearby Homes
- 3535 E Cook St Unit 31
- 2991 Niccolls Rd
- 3011 Niccolls Rd
- 1105 Knoll Pointe Place
- 530 S Livingston St Unit 1
- 143 S Wesley St Unit 1
- 3309 E Carpenter St Unit 1
- 1905 Greentree Rd
- 2331 South Grand Ave E
- 3121 E Carpenter St Unit 1
- 2310 E Kansas St
- 404 N Daniels Ave
- 160 Forrest Ave Unit FP-35
- 2128 E Capitol Ave
- 300 Forrest Ave Unit 120
- 300 Forrest Ave Unit 62
- 300 Forrest Ave Unit 103
- 300 Forrest Ave Unit 59
- 300 Forrest Ave Unit 107
- 300 Forrest Ave Unit 41
- 3639 South Grand Ave E
- 3641 South Grand Ave E
- 3643 South Grand Ave E
- 3701 South Grand Ave E Unit 1
- 3700 South Grand Ave E
- 3709 South Grand Ave E Unit 1
- 3714 South Grand Ave E Unit 1
- 3714 South Grand Ave E
- 2865 Alpine Dr Unit 1
- 1091 Tansey Rd
- 3754 E Cook St Unit 1
- 2825 Alpine Dr Unit 1
- 1059 Tansey Ave
- 3750 E Cook St
- 2905 Alpine Dr
- 2945 Alpine Dr
- 3700 E Cook St
- 2870 Alpine Dr Unit 1
- 2965 Alpine Dr
- 1048 Tansey Ave Unit 1