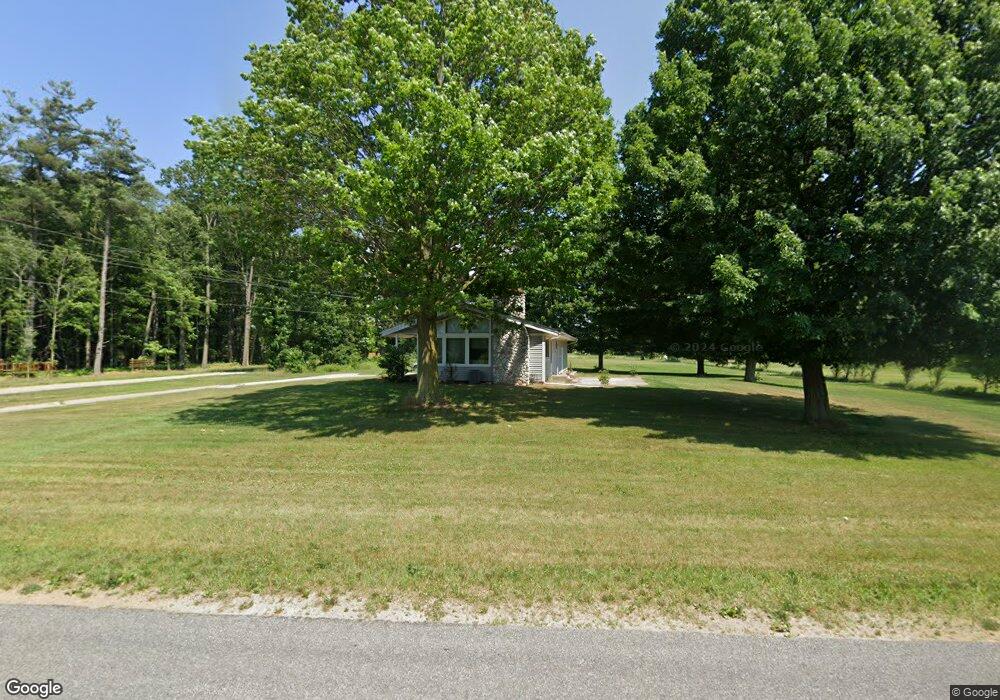
364 80th Ave Zeeland, MI 49464
Estimated Value: $334,252 - $416,000
2
Beds
1
Bath
1,194
Sq Ft
$315/Sq Ft
Est. Value
About This Home
This home is located at 364 80th Ave, Zeeland, MI 49464 and is currently estimated at $375,563, approximately $314 per square foot. 364 80th Ave is a home located in Ottawa County with nearby schools including Cityside Middle School, Zeeland East High School, and Zeeland Christian School.
Ownership History
Date
Name
Owned For
Owner Type
Purchase Details
Closed on
Dec 14, 2007
Sold by
Cook Warren
Bought by
Geib Randall L
Current Estimated Value
Home Financials for this Owner
Home Financials are based on the most recent Mortgage that was taken out on this home.
Original Mortgage
$63,000
Outstanding Balance
$39,897
Interest Rate
6.31%
Mortgage Type
Purchase Money Mortgage
Estimated Equity
$335,666
Purchase Details
Closed on
Aug 24, 2007
Sold by
Mortgage Electronic Registration Systems
Bought by
Bank Of New York
Purchase Details
Closed on
Aug 9, 2007
Sold by
Laduke Nathaniel J
Bought by
Mortgage Electronic Registration Systems
Purchase Details
Closed on
Jun 9, 2004
Sold by
Blauwkamp Nancy J
Bought by
Laduke Nathaniel J
Home Financials for this Owner
Home Financials are based on the most recent Mortgage that was taken out on this home.
Original Mortgage
$152,900
Interest Rate
7.05%
Mortgage Type
Purchase Money Mortgage
Create a Home Valuation Report for This Property
The Home Valuation Report is an in-depth analysis detailing your home's value as well as a comparison with similar homes in the area
Home Values in the Area
Average Home Value in this Area
Purchase History
| Date | Buyer | Sale Price | Title Company |
|---|---|---|---|
| Geib Randall L | $133,000 | Triunion Title | |
| Cook Warren | -- | Triunion Title | |
| Bank Of New York | -- | None Available | |
| Mortgage Electronic Registration Systems | $158,249 | None Available | |
| Laduke Nathaniel J | $152,900 | -- |
Source: Public Records
Mortgage History
| Date | Status | Borrower | Loan Amount |
|---|---|---|---|
| Open | Cook Warren | $63,000 | |
| Previous Owner | Laduke Nathaniel J | $152,900 |
Source: Public Records
Tax History Compared to Growth
Tax History
| Year | Tax Paid | Tax Assessment Tax Assessment Total Assessment is a certain percentage of the fair market value that is determined by local assessors to be the total taxable value of land and additions on the property. | Land | Improvement |
|---|---|---|---|---|
| 2025 | $2,765 | $154,600 | $0 | $0 |
| 2024 | $1,763 | $150,700 | $0 | $0 |
| 2023 | $1,683 | $130,700 | $0 | $0 |
| 2022 | $2,505 | $110,500 | $0 | $0 |
| 2021 | $2,504 | $104,400 | $0 | $0 |
| 2020 | $2,442 | $98,900 | $0 | $0 |
| 2019 | $2,441 | $91,700 | $0 | $0 |
| 2018 | $2,784 | $83,800 | $0 | $0 |
| 2017 | -- | $83,800 | $0 | $0 |
| 2016 | -- | $78,900 | $0 | $0 |
| 2015 | -- | $74,000 | $0 | $0 |
| 2014 | -- | $69,400 | $0 | $0 |
Source: Public Records
Map
Nearby Homes
- 7505 Woodland Way
- 4675 44th St
- 7200 Adams St
- 1439 84th Ave
- 975 Bluff Lake Dr
- 938 Mid Bluff Dr
- 9483 Bluff Ridge Dr Unit Lot 192
- 1868 Suntree Ln
- 177 96th Ave
- 0 96th Ave Unit 1.94 25027197
- 0 96th Ave
- 8903 N Clearwater Dr Unit 123
- 764 64th Ave
- 9139 Perry Ct Unit Lot A
- 9140 Perry Ct Unit Lot B
- 2056 84th Ave
- 9180 Perry Ct Unit Lot D
- 8951 N Clearwater Dr Unit 99
- 7584 Ridgeline Dr
- 241 Woodlawn Ct