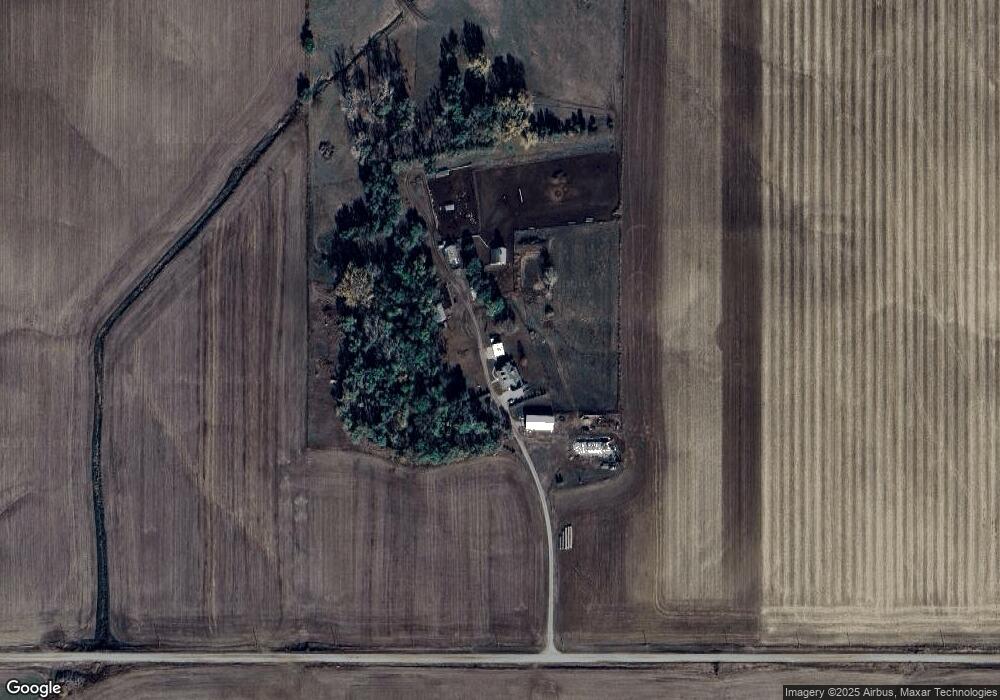
364 C Rd Howells, NE 68641
Estimated Value: $427,000 - $580,000
3
Beds
4
Baths
2,760
Sq Ft
$180/Sq Ft
Est. Value
About This Home
This home is located at 364 C Rd, Howells, NE 68641 and is currently estimated at $497,825, approximately $180 per square foot. 364 C Rd is a home located in Cuming County with nearby schools including Howells-Dodge Elementary School, Howells-Dodge Consolidated Public School, and Howells Senior High School.
Ownership History
Date
Name
Owned For
Owner Type
Purchase Details
Closed on
Jul 28, 2023
Sold by
Brester Kevin R and Brester Christine A
Bought by
Brabec Eric Daniel and Brabec Tiffany A
Current Estimated Value
Home Financials for this Owner
Home Financials are based on the most recent Mortgage that was taken out on this home.
Original Mortgage
$380,000
Outstanding Balance
$369,998
Interest Rate
6.69%
Mortgage Type
New Conventional
Estimated Equity
$127,827
Purchase Details
Closed on
Aug 16, 2018
Sold by
Brandyberry Neal L and Brandyberry Gaile F
Bought by
Brester Kevin R and Brester Christine A
Create a Home Valuation Report for This Property
The Home Valuation Report is an in-depth analysis detailing your home's value as well as a comparison with similar homes in the area
Home Values in the Area
Average Home Value in this Area
Purchase History
| Date | Buyer | Sale Price | Title Company |
|---|---|---|---|
| Brabec Eric Daniel | $400,000 | None Listed On Document | |
| Brester Kevin R | $822,500 | None Available |
Source: Public Records
Mortgage History
| Date | Status | Borrower | Loan Amount |
|---|---|---|---|
| Open | Brabec Eric Daniel | $380,000 |
Source: Public Records
Tax History Compared to Growth
Tax History
| Year | Tax Paid | Tax Assessment Tax Assessment Total Assessment is a certain percentage of the fair market value that is determined by local assessors to be the total taxable value of land and additions on the property. | Land | Improvement |
|---|---|---|---|---|
| 2025 | $3,234 | $676,685 | $122,095 | $554,590 |
| 2024 | $3,234 | $596,500 | $113,150 | $483,350 |
| 2023 | $4,693 | $573,005 | $103,360 | $469,645 |
| 2022 | $6,422 | $730,305 | $347,760 | $382,545 |
| 2021 | $6,095 | $689,920 | $342,945 | $346,975 |
| 2020 | $5,643 | $643,445 | $342,945 | $300,500 |
| 2019 | $5,312 | $602,240 | $336,935 | $265,305 |
| 2018 | $5,202 | $590,110 | $337,130 | $252,980 |
| 2017 | $5,008 | $567,115 | $334,845 | $232,270 |
| 2016 | $5,035 | $547,460 | $334,845 | $212,615 |
| 2015 | $4,790 | $503,245 | $290,630 | $212,615 |
| 2014 | $4,974 | $475,975 | $249,105 | $226,870 |
| 2013 | $4,974 | $393,905 | $168,950 | $224,955 |
Source: Public Records
Map
Nearby Homes
- 711 Main St
- 218 N 6th St
- 223 S 6th St
- 134 N Linden St
- 517 W 3rd St
- 402 W Pine St
- 301 W Pine St
- 205 E Sheridan St
- 101 S Main St
- 519 S Niphon St
- 208 N Lincoln St
- 626 S Monitor St
- 1207 N Main St
- 420 S Farragut St
- 1402 E Bridge St
- 749 E Grove St
- 335 E Short St
- 111 Ash St
- 126 E Grove St
- 1401 20th Street Cir
