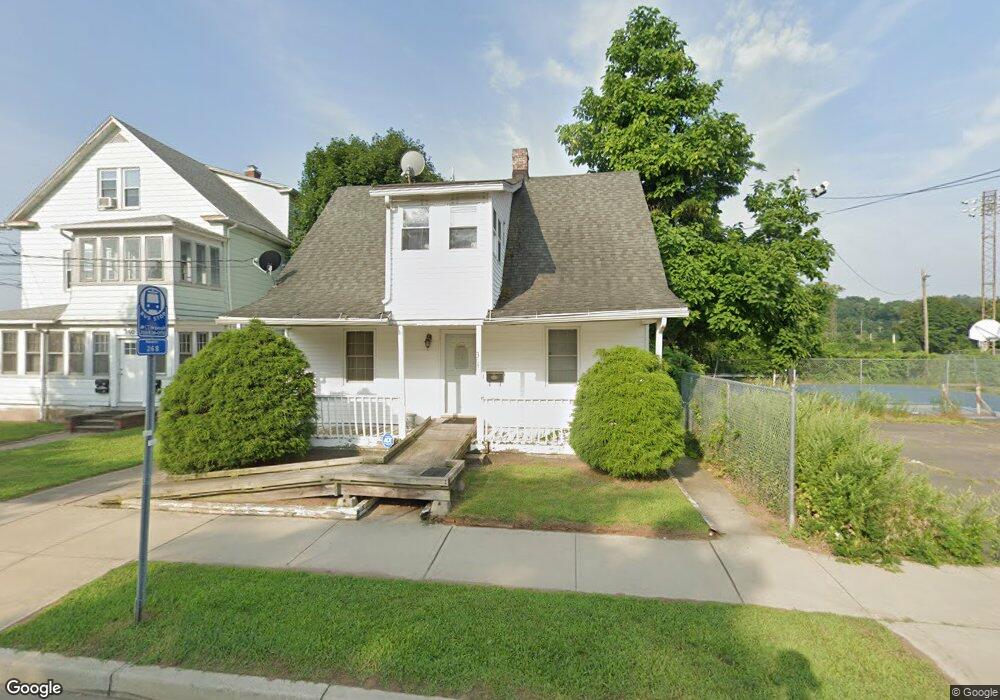
364 Front Ave West Haven, CT 06516
Allingtown NeighborhoodEstimated Value: $252,000 - $316,000
3
Beds
2
Baths
1,008
Sq Ft
$277/Sq Ft
Est. Value
About This Home
This home is located at 364 Front Ave, West Haven, CT 06516 and is currently estimated at $279,201, approximately $276 per square foot. 364 Front Ave is a home located in New Haven County with nearby schools including Carrigan 5/6 Intermediate School, Harry M. Bailey Middle School, and West Haven High School.
Ownership History
Date
Name
Owned For
Owner Type
Purchase Details
Closed on
May 4, 2005
Sold by
Kent Shawn P
Bought by
Johnson Ernestine
Current Estimated Value
Home Financials for this Owner
Home Financials are based on the most recent Mortgage that was taken out on this home.
Original Mortgage
$30,400
Interest Rate
5.5%
Mortgage Type
Purchase Money Mortgage
Purchase Details
Closed on
Jan 31, 2002
Sold by
Gold Properties Llc
Bought by
Kent Shawn P
Purchase Details
Closed on
Mar 23, 2001
Sold by
Conseco Fin Svc Corp
Bought by
Gold Prop Llc
Purchase Details
Closed on
Dec 20, 1994
Sold by
Petrowsky Ent Inc
Bought by
Sampson David J and Sampson Paul D
Purchase Details
Closed on
Feb 8, 1990
Sold by
Delisle Tr Alan D
Bought by
Sampson Shirley
Purchase Details
Closed on
Apr 24, 1987
Sold by
Patchet William E
Bought by
Sampson David
Create a Home Valuation Report for This Property
The Home Valuation Report is an in-depth analysis detailing your home's value as well as a comparison with similar homes in the area
Home Values in the Area
Average Home Value in this Area
Purchase History
| Date | Buyer | Sale Price | Title Company |
|---|---|---|---|
| Johnson Ernestine | $152,000 | -- | |
| Kent Shawn P | $89,000 | -- | |
| Gold Prop Llc | $45,000 | -- | |
| Sampson David J | $52,500 | -- | |
| Petrowsky Ent Inc | $21,000 | -- | |
| Johnson Ernestine | $152,000 | -- | |
| Kent Shawn P | $89,000 | -- | |
| Gold Prop Llc | $45,000 | -- | |
| Sampson David J | $52,500 | -- | |
| Sampson Shirley | $128,000 | -- | |
| Sampson David | $106,500 | -- |
Source: Public Records
Mortgage History
| Date | Status | Borrower | Loan Amount |
|---|---|---|---|
| Closed | Sampson David | $36,000 | |
| Closed | Sampson David | $30,400 |
Source: Public Records
Tax History Compared to Growth
Tax History
| Year | Tax Paid | Tax Assessment Tax Assessment Total Assessment is a certain percentage of the fair market value that is determined by local assessors to be the total taxable value of land and additions on the property. | Land | Improvement |
|---|---|---|---|---|
| 2025 | $5,390 | $158,480 | $60,130 | $98,350 |
| 2024 | $4,992 | $104,230 | $41,650 | $62,580 |
| 2023 | $4,838 | $104,230 | $41,650 | $62,580 |
| 2022 | $4,754 | $104,230 | $41,650 | $62,580 |
| 2021 | $4,755 | $104,230 | $41,650 | $62,580 |
| 2020 | $4,586 | $89,040 | $33,600 | $55,440 |
| 2019 | $4,514 | $89,040 | $33,600 | $55,440 |
| 2018 | $4,391 | $89,040 | $33,600 | $55,440 |
| 2017 | $4,254 | $89,040 | $33,600 | $55,440 |
| 2016 | $4,125 | $89,040 | $33,600 | $55,440 |
| 2015 | $3,848 | $94,570 | $37,310 | $57,260 |
| 2014 | $3,771 | $94,570 | $37,310 | $57,260 |
Source: Public Records
Map
Nearby Homes
- 14 Homestead Ave
- 22 Bristol St
- 103 Gilbert St
- 38 Chauncey St
- 194 Ella T Grasso Blvd
- 1014 Campbell Ave Unit 14
- 43 Clifton St
- 65 Westfield St
- 60 Andrews St
- 941 Campbell Ave
- 22 Thill St
- 104 Terrace Ave
- 29 Birch St
- 81 Homeside Ave
- 312 Davenport Ave
- 25 Richards St
- 467 Columbus Ave
- 35 Terrace Ave
- 56 Ann St
- 29 Abner St
- 350 Front Ave
- 350 Front Ave Unit Garage
- 350 Front Ave Unit Back
- 350 Front Ave Unit 2
- 334 Front Ave
- 351 Front Ave
- 326 Front Ave
- 110B Burban Dr
- 316 Front Ave
- 312 Front Ave
- 13 Locust St
- 308 Front Ave
- 29 Locust St
- 414 Front Ave
- 299 Front Ave
- 103 Taft Ave
- 33 Locust St
- 4 Locust St
- 420 Front Ave
- 109 Taft Ave