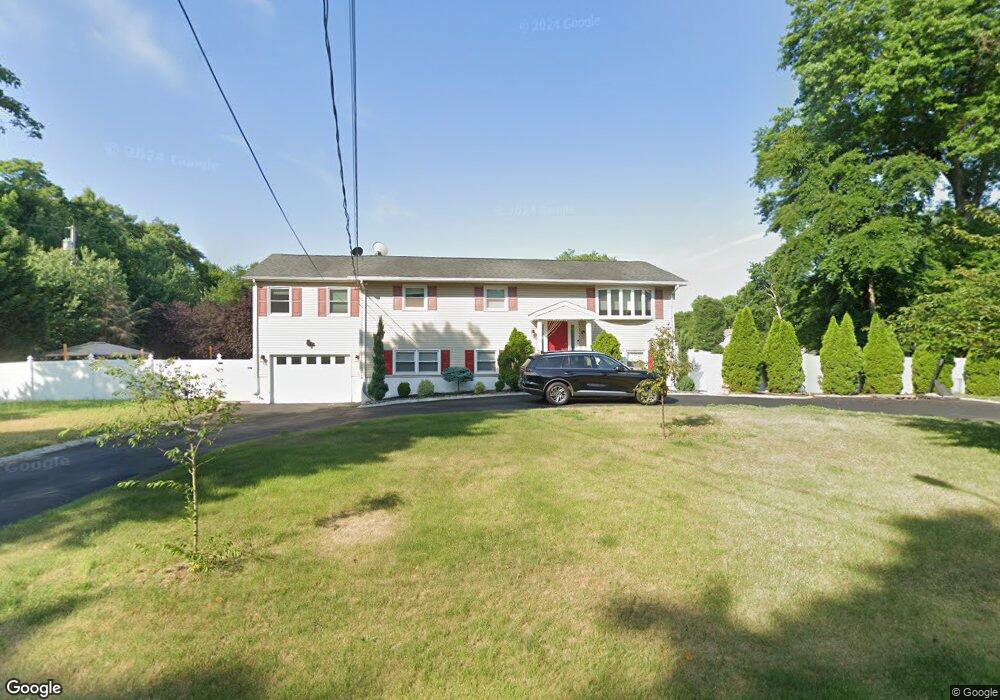
364 Green St Old Bridge, NJ 08857
Estimated Value: $646,715 - $822,000
--
Bed
--
Bath
2,530
Sq Ft
$300/Sq Ft
Est. Value
About This Home
This home is located at 364 Green St, Old Bridge, NJ 08857 and is currently estimated at $758,429, approximately $299 per square foot. 364 Green St is a home located in Middlesex County with nearby schools including Old Bridge High School, St. Thomas the Apostle School, and St. Ambrose School.
Ownership History
Date
Name
Owned For
Owner Type
Purchase Details
Closed on
Nov 4, 2019
Sold by
Singh Manjit and Kaur Mandeep
Bought by
Kaur Mandeep
Current Estimated Value
Home Financials for this Owner
Home Financials are based on the most recent Mortgage that was taken out on this home.
Original Mortgage
$209,000
Outstanding Balance
$139,336
Interest Rate
3.5%
Mortgage Type
New Conventional
Estimated Equity
$619,093
Purchase Details
Closed on
Sep 25, 2019
Sold by
Singh Manjit
Bought by
Singh Manjit and Kaur Mandeep
Home Financials for this Owner
Home Financials are based on the most recent Mortgage that was taken out on this home.
Original Mortgage
$209,000
Outstanding Balance
$139,336
Interest Rate
3.5%
Mortgage Type
New Conventional
Estimated Equity
$619,093
Purchase Details
Closed on
May 25, 2005
Sold by
Nuzzolo Denise
Bought by
Singh Manjit
Home Financials for this Owner
Home Financials are based on the most recent Mortgage that was taken out on this home.
Original Mortgage
$340,000
Interest Rate
5.83%
Create a Home Valuation Report for This Property
The Home Valuation Report is an in-depth analysis detailing your home's value as well as a comparison with similar homes in the area
Home Values in the Area
Average Home Value in this Area
Purchase History
| Date | Buyer | Sale Price | Title Company |
|---|---|---|---|
| Kaur Mandeep | -- | None Available | |
| Singh Manjit | -- | Pure Title Llc | |
| Singh Manjit | $465,000 | -- |
Source: Public Records
Mortgage History
| Date | Status | Borrower | Loan Amount |
|---|---|---|---|
| Open | Singh Manjit | $209,000 | |
| Closed | Singh Manjit | $340,000 |
Source: Public Records
Tax History Compared to Growth
Tax History
| Year | Tax Paid | Tax Assessment Tax Assessment Total Assessment is a certain percentage of the fair market value that is determined by local assessors to be the total taxable value of land and additions on the property. | Land | Improvement |
|---|---|---|---|---|
| 2025 | $9,860 | $174,600 | $52,800 | $121,800 |
| 2024 | $9,458 | $174,600 | $52,800 | $121,800 |
| 2023 | $9,458 | $174,600 | $52,800 | $121,800 |
| 2022 | $9,242 | $174,600 | $52,800 | $121,800 |
| 2021 | $6,328 | $174,600 | $52,800 | $121,800 |
| 2020 | $8,969 | $174,600 | $52,800 | $121,800 |
| 2019 | $8,817 | $174,600 | $52,800 | $121,800 |
| 2018 | $8,720 | $174,600 | $52,800 | $121,800 |
| 2017 | $8,437 | $174,600 | $52,800 | $121,800 |
| 2016 | $8,262 | $174,600 | $52,800 | $121,800 |
| 2015 | $8,119 | $174,600 | $52,800 | $121,800 |
| 2014 | $8,037 | $174,600 | $52,800 | $121,800 |
Source: Public Records
Map
Nearby Homes