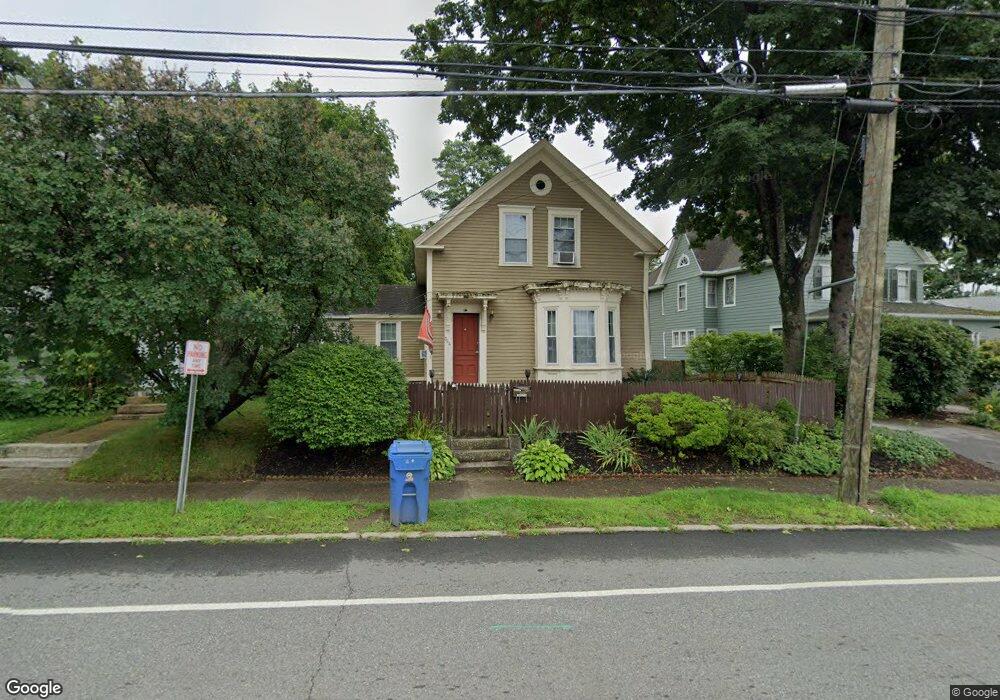
364 Main St Danielson, CT 06239
Estimated Value: $276,000 - $309,000
4
Beds
1
Bath
1,293
Sq Ft
$220/Sq Ft
Est. Value
About This Home
This home is located at 364 Main St, Danielson, CT 06239 and is currently estimated at $284,514, approximately $220 per square foot. 364 Main St is a home located in Windham County with nearby schools including Killingly Central School, Killingly Memorial School, and Killingly Intermediate School.
Ownership History
Date
Name
Owned For
Owner Type
Purchase Details
Closed on
Jun 5, 2017
Sold by
Smith Jean B
Bought by
Renaud Douglas
Current Estimated Value
Home Financials for this Owner
Home Financials are based on the most recent Mortgage that was taken out on this home.
Original Mortgage
$50,000
Interest Rate
3.97%
Mortgage Type
Purchase Money Mortgage
Purchase Details
Closed on
Feb 1, 1989
Sold by
Herklots Adriaan
Bought by
Choleva John
Home Financials for this Owner
Home Financials are based on the most recent Mortgage that was taken out on this home.
Original Mortgage
$88,200
Interest Rate
10.62%
Mortgage Type
Purchase Money Mortgage
Create a Home Valuation Report for This Property
The Home Valuation Report is an in-depth analysis detailing your home's value as well as a comparison with similar homes in the area
Home Values in the Area
Average Home Value in this Area
Purchase History
| Date | Buyer | Sale Price | Title Company |
|---|---|---|---|
| Renaud Douglas | $50,000 | -- | |
| Renaud Douglas | $50,000 | -- | |
| Choleva John | $89,500 | -- |
Source: Public Records
Mortgage History
| Date | Status | Borrower | Loan Amount |
|---|---|---|---|
| Closed | Choleva John | $50,000 | |
| Previous Owner | Choleva John | $31,000 | |
| Previous Owner | Choleva John | $88,200 |
Source: Public Records
Tax History Compared to Growth
Tax History
| Year | Tax Paid | Tax Assessment Tax Assessment Total Assessment is a certain percentage of the fair market value that is determined by local assessors to be the total taxable value of land and additions on the property. | Land | Improvement |
|---|---|---|---|---|
| 2025 | $3,647 | $145,600 | $24,570 | $121,030 |
| 2024 | $3,482 | $145,600 | $24,570 | $121,030 |
| 2023 | $3,196 | $99,610 | $20,230 | $79,380 |
| 2022 | $3,007 | $99,610 | $20,230 | $79,380 |
| 2021 | $3,007 | $99,610 | $20,230 | $79,380 |
| 2020 | $2,957 | $99,610 | $20,230 | $79,380 |
| 2019 | $2,989 | $99,610 | $20,230 | $79,380 |
| 2017 | $2,443 | $75,740 | $12,810 | $62,930 |
| 2016 | $2,443 | $75,740 | $12,810 | $62,930 |
| 2015 | $2,394 | $75,740 | $12,810 | $62,930 |
| 2014 | $2,337 | $75,740 | $12,810 | $62,930 |
Source: Public Records
Map
Nearby Homes
- 409 Main St
- 94 Mechanic St
- 24 Center St
- 102 Cottage St
- 16 James St
- 58 Athol St Unit 58
- 78 Athol St
- 74 Athol St
- 72 Main St
- 63 Athol St
- 65 Stone St
- 48 Athol St Unit 48
- 144 Prospect Ave
- 133 Maple St
- 513 Lhomme Street Extension
- 37 Katherine Ave
- 110 Franklin St
- 17 Hillside Terrace
- 18 Broad St
- 415 Maple St