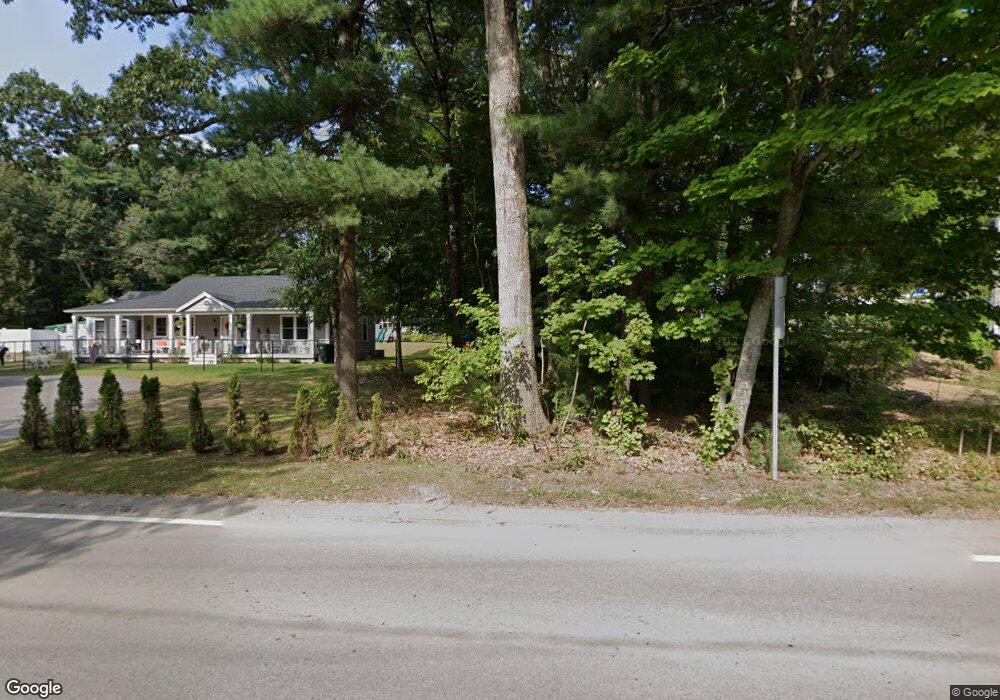
364 Main St Marshfield, MA 02050
Estimated Value: $636,000 - $880,000
2
Beds
2
Baths
1,312
Sq Ft
$560/Sq Ft
Est. Value
About This Home
This home is located at 364 Main St, Marshfield, MA 02050 and is currently estimated at $734,858, approximately $560 per square foot. 364 Main St is a home located in Plymouth County with nearby schools including South River, Furnace Brook Middle School, and Marshfield High School.
Ownership History
Date
Name
Owned For
Owner Type
Purchase Details
Closed on
Oct 14, 2015
Sold by
Df Nt and Davis William G
Bought by
Davis Francis X
Current Estimated Value
Purchase Details
Closed on
Apr 1, 2014
Sold by
J P D Nt and Davis Joseph M
Bought by
Davis Francis X
Purchase Details
Closed on
Jun 24, 2002
Sold by
Jpd Nt and Davis Francis X
Bought by
Paris Rt and France Hugh B
Home Financials for this Owner
Home Financials are based on the most recent Mortgage that was taken out on this home.
Original Mortgage
$349,000
Interest Rate
6.81%
Mortgage Type
Purchase Money Mortgage
Create a Home Valuation Report for This Property
The Home Valuation Report is an in-depth analysis detailing your home's value as well as a comparison with similar homes in the area
Home Values in the Area
Average Home Value in this Area
Purchase History
We collect this data history from publicly available records. To have your information removed, we recommend requesting removal directly through your county’s website.
| Date | Buyer | Sale Price | Title Company |
|---|---|---|---|
| Davis Francis X | -- | -- | |
| Davis Francis X | -- | -- | |
| Paris Rt | $350,000 | -- |
Source: Public Records
Mortgage History
We collect this data history from publicly available records. To have your information removed, we recommend requesting removal directly through your county’s website.
| Date | Status | Borrower | Loan Amount |
|---|---|---|---|
| Previous Owner | Paris Rt | $349,000 |
Source: Public Records
Tax History
| Year | Tax Paid | Tax Assessment Tax Assessment Total Assessment is a certain percentage of the fair market value that is determined by local assessors to be the total taxable value of land and additions on the property. | Land | Improvement |
|---|---|---|---|---|
| 2025 | $5,805 | $586,400 | $312,100 | $274,300 |
| 2024 | $5,658 | $544,600 | $297,200 | $247,400 |
| 2023 | $5,386 | $503,100 | $276,000 | $227,100 |
| 2022 | $5,386 | $415,900 | $222,900 | $193,000 |
| 2021 | $5,267 | $399,300 | $220,800 | $178,500 |
| 2020 | $4,997 | $374,900 | $201,700 | $173,200 |
| 2019 | $4,114 | $307,500 | $201,700 | $105,800 |
| 2018 | $4,261 | $318,700 | $201,700 | $117,000 |
| 2017 | $4,163 | $303,400 | $191,100 | $112,300 |
| 2016 | $3,929 | $283,100 | $180,500 | $102,600 |
| 2015 | $3,667 | $275,900 | $180,500 | $95,400 |
| 2014 | $3,434 | $258,400 | $165,600 | $92,800 |
Source: Public Records
Map
Nearby Homes
- 24 Proctor St
- 180 Plain St
- 25 Lynn St
- 2 Proprietors Dr Unit 25
- 3 Proprietors Dr Unit 7
- 757 S River St
- 8 Duxbury St
- 848 Plain St Unit 28
- 848 Plain St Unit 32
- 18 Somerville St
- 152 Acorn St
- 21 Washington Ave
- 134 Wellington Ave
- 599 Moraine St
- 155 Quincy Ave
- 713 Webster St
- 3 Harlow Brook Way Unit 3
- 2 Harlow Brook Way Unit 2
- 20 Seager Farm Rd
- 30 Tupelo Rd
Your Personal Tour Guide
Ask me questions while you tour the home.