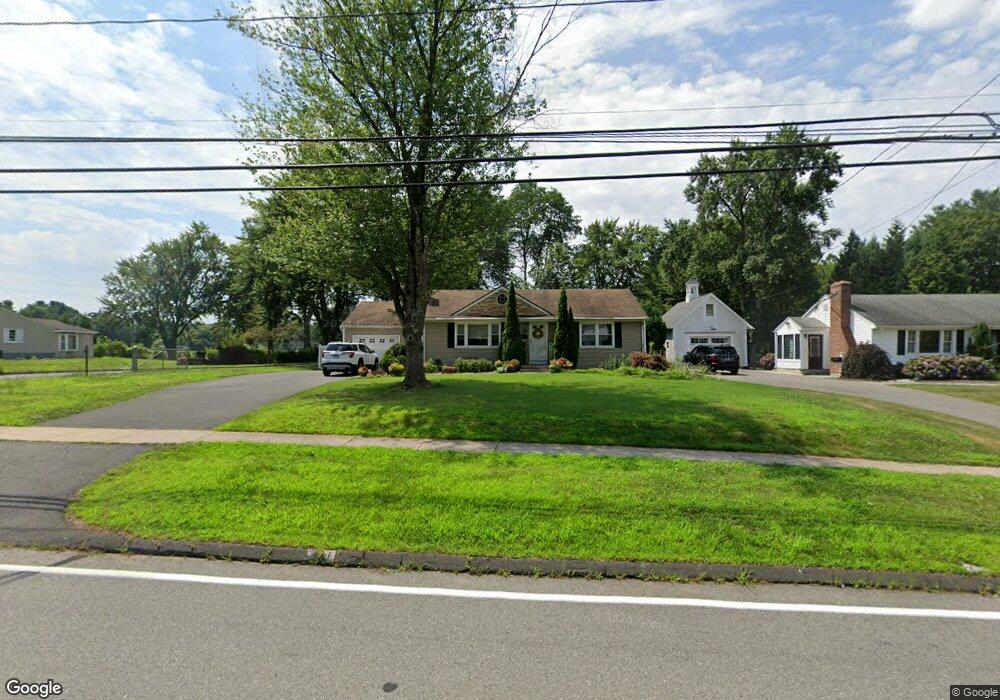
364 Parsonage St Rocky Hill, CT 06067
Estimated Value: $327,000 - $417,000
3
Beds
1
Bath
1,132
Sq Ft
$330/Sq Ft
Est. Value
About This Home
This home is located at 364 Parsonage St, Rocky Hill, CT 06067 and is currently estimated at $373,017, approximately $329 per square foot. 364 Parsonage St is a home located in Hartford County with nearby schools including Albert D. Griswold Middle School, Rocky Hill High School, and Corpus Christi School.
Ownership History
Date
Name
Owned For
Owner Type
Purchase Details
Closed on
May 28, 2021
Sold by
Torneo Nick A and Torneo Sharon A
Bought by
Carone Karlee A
Current Estimated Value
Home Financials for this Owner
Home Financials are based on the most recent Mortgage that was taken out on this home.
Original Mortgage
$284,900
Outstanding Balance
$257,941
Interest Rate
2.9%
Mortgage Type
FHA
Estimated Equity
$115,076
Purchase Details
Closed on
Aug 7, 2006
Sold by
Est Wolfson Gladys and Marion George W
Bought by
Torneo Nick A and Torneo Sharon A
Home Financials for this Owner
Home Financials are based on the most recent Mortgage that was taken out on this home.
Original Mortgage
$166,400
Interest Rate
6.7%
Create a Home Valuation Report for This Property
The Home Valuation Report is an in-depth analysis detailing your home's value as well as a comparison with similar homes in the area
Home Values in the Area
Average Home Value in this Area
Purchase History
| Date | Buyer | Sale Price | Title Company |
|---|---|---|---|
| Carone Karlee A | $300,000 | None Available | |
| Carone Karlee A | $300,000 | None Available | |
| Torneo Nick A | $208,000 | -- | |
| Torneo Nick A | $208,000 | -- |
Source: Public Records
Mortgage History
| Date | Status | Borrower | Loan Amount |
|---|---|---|---|
| Open | Carone Karlee A | $284,900 | |
| Closed | Carone Karlee A | $284,900 | |
| Previous Owner | Torneo Nick A | $25,000 | |
| Previous Owner | Torneo Nick A | $166,400 | |
| Previous Owner | Torneo Nick A | $25,000 |
Source: Public Records
Tax History
| Year | Tax Paid | Tax Assessment Tax Assessment Total Assessment is a certain percentage of the fair market value that is determined by local assessors to be the total taxable value of land and additions on the property. | Land | Improvement |
|---|---|---|---|---|
| 2025 | $5,830 | $192,780 | $65,520 | $127,260 |
| 2024 | $5,623 | $192,780 | $65,520 | $127,260 |
| 2023 | $5,509 | $153,370 | $64,540 | $88,830 |
| 2022 | $5,294 | $153,370 | $64,540 | $88,830 |
| 2021 | $5,230 | $153,370 | $64,540 | $88,830 |
| 2020 | $5,153 | $153,370 | $64,540 | $88,830 |
| 2019 | $4,898 | $150,710 | $64,540 | $86,170 |
| 2018 | $4,513 | $139,300 | $58,100 | $81,200 |
| 2017 | $4,384 | $138,740 | $58,100 | $80,640 |
| 2016 | $4,119 | $132,860 | $58,100 | $74,760 |
| 2015 | $3,946 | $132,860 | $58,100 | $74,760 |
| 2014 | $3,946 | $132,860 | $58,100 | $74,760 |
Source: Public Records
Map
Nearby Homes
- 18 Mcintosh Cir Unit 18
- 1610 Silas Deane Hwy
- 59 Chapin Ave
- 92 Berkshire Rd
- 99 Elm Ridge Dr
- 11 Charter Rd
- 204 Cedar Hollow Dr Unit 204
- 268 Fox Hill Rd
- 41 Carillon Dr Unit D
- 36 Copper Beech Dr
- 20 Little Oak Ln Unit 20
- 667 (lot 2) West St
- 31 Ox Yoke Dr
- 38 Butternut Ln
- 74 Dividend Rd
- 7 Stepney Cir
- 23 Locust Cir Unit 23
- 89 Merriman Rd
- 38 Wheeler Rd
- 9 Dogwood Ct
- 372 Parsonage St
- 365 Parsonage St
- 350 Parsonage St
- 357 Parsonage St
- 380 Parsonage St
- 349 Parsonage St
- 381 Parsonage St
- 342 Parsonage St
- 343 Parsonage St
- 392 Parsonage St
- 389 Parsonage St
- 335 Parsonage St
- 332 Parsonage St
- 326 Parsonage St
- 397 Parsonage St
- 321 Parsonage St
- 406 Parsonage St
- 316 Parsonage St
- 10 Winesap Cir
- 14 Winesap Cir
Your Personal Tour Guide
Ask me questions while you tour the home.