Estimated Value: $216,869 - $496,000
--
Bed
--
Bath
1,142
Sq Ft
$267/Sq Ft
Est. Value
About This Home
This home is located at 364 Powell Rd SE, Rome, GA 30161 and is currently estimated at $304,717, approximately $266 per square foot. 364 Powell Rd SE is a home located in Floyd County with nearby schools including Pepperell Middle School and Pepperell High School.
Ownership History
Date
Name
Owned For
Owner Type
Purchase Details
Closed on
Aug 31, 2017
Sold by
Watkins Grace Bell Norris
Bought by
Watkins Ernest A
Current Estimated Value
Purchase Details
Closed on
May 13, 2014
Sold by
Watkins Ernest 73.74% and Watkins Grace
Bought by
Watkins Ernest 73.74% and Race Watkins Est
Purchase Details
Closed on
Feb 8, 2007
Sold by
Not Provided
Bought by
Watkins Ernest 73 74 and Watkins Grace 26 26
Purchase Details
Closed on
Apr 18, 2006
Sold by
Not Provided
Bought by
Watkins Ernest 73 74 and Watkins Grace 26 26
Purchase Details
Closed on
Jun 3, 1997
Sold by
Watkins Grace
Bought by
Watkins Grace and Ada Chaney
Purchase Details
Closed on
Mar 4, 1992
Sold by
Chaney Ada
Bought by
Watkins Grace
Purchase Details
Closed on
Jan 2, 1992
Sold by
Watkins Grace Int
Bought by
Chaney Ada
Purchase Details
Closed on
Oct 11, 1984
Sold by
Watkins Grace and Mae Della Weems
Bought by
Watkins Grace Int
Purchase Details
Closed on
Oct 20, 1982
Bought by
Watkins Grace and Mae Della Weems
Create a Home Valuation Report for This Property
The Home Valuation Report is an in-depth analysis detailing your home's value as well as a comparison with similar homes in the area
Home Values in the Area
Average Home Value in this Area
Purchase History
| Date | Buyer | Sale Price | Title Company |
|---|---|---|---|
| Watkins Ernest A | -- | -- | |
| Watkins Ernest 73.74% | -- | -- | |
| Watkins Ernest 73 74 | -- | -- | |
| Watkins Ernest 73 74 | -- | -- | |
| Watkins Grace | -- | -- | |
| Watkins Grace | -- | -- | |
| Chaney Ada | -- | -- | |
| Watkins Grace Int | -- | -- | |
| Watkins Grace | -- | -- |
Source: Public Records
Tax History Compared to Growth
Tax History
| Year | Tax Paid | Tax Assessment Tax Assessment Total Assessment is a certain percentage of the fair market value that is determined by local assessors to be the total taxable value of land and additions on the property. | Land | Improvement |
|---|---|---|---|---|
| 2024 | $2,076 | $62,904 | $16,896 | $46,008 |
| 2023 | $1,800 | $54,840 | $15,360 | $39,480 |
| 2022 | $1,172 | $39,492 | $12,704 | $26,788 |
| 2021 | $982 | $32,544 | $11,558 | $20,986 |
| 2020 | $842 | $27,672 | $10,051 | $17,621 |
| 2019 | $805 | $26,799 | $10,051 | $16,748 |
| 2018 | $765 | $25,424 | $9,573 | $15,851 |
| 2017 | $731 | $24,246 | $8,864 | $15,382 |
| 2016 | $732 | $23,999 | $8,840 | $15,159 |
| 2015 | $334 | $23,999 | $8,840 | $15,159 |
| 2014 | $334 | $23,999 | $8,840 | $15,159 |
Source: Public Records
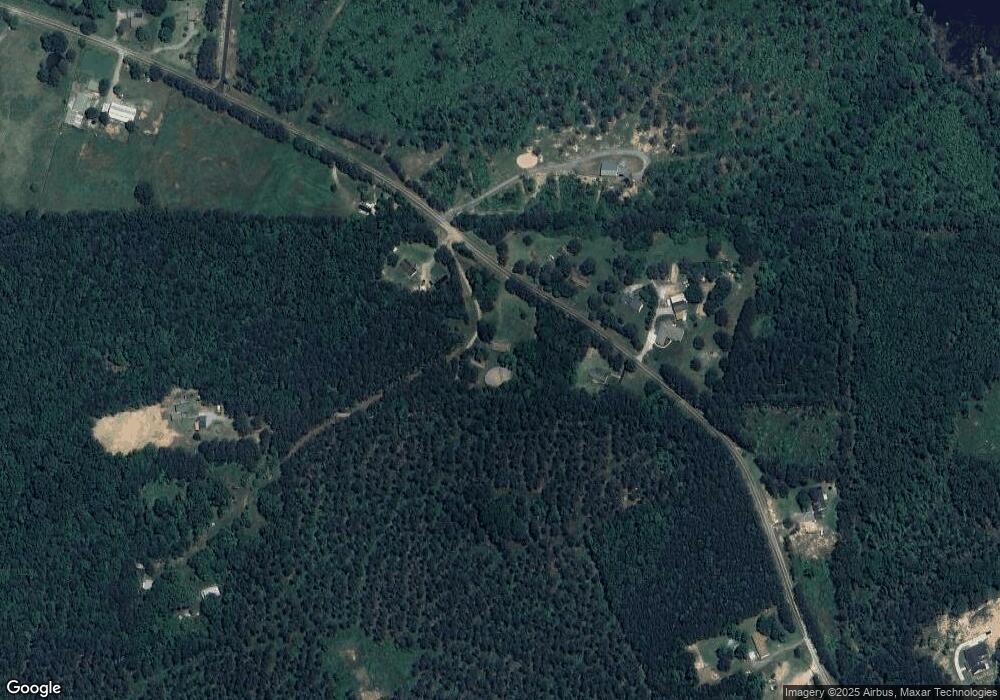
Map
Nearby Homes
- 344 Powell Rd SE
- 0 Powell Rd SE Unit 10606945
- 375 Druid Rd SE
- 3810 Chulio Rd SE
- 0 Satcher Rd Unit 10626187
- 0 Satcher Rd Unit 7666911
- 0 Satcher Rd Unit 19425114
- 0 Satcher Rd Unit 4 19430080
- 0 Satcher Rd Unit 4 20170176
- 0 Satcher Rd Unit 1 20170093
- 00 Satcher Rd
- 20 Satcher Rd
- 00000 Satcher Rd
- 16 Unbridled Rd Unit 22
- 16 Unbridled Rd
- 0 John Kay Rd Unit 10497667
- 0 John Kay Rd Unit 22982738
- 0 John Kay Rd Unit 22961024
- 0 John Kay Rd Unit 22961830
- 0 John Kay Rd Unit 10451223
- 395 Powell Rd SE
- 395 Powell Rd SE
- 402 Powell Rd SE
- 332 Powell Rd SE
- 295 Powell Rd SE
- 413 Powell Rd SE
- 413 Powell Rd SE
- 413 Powell Rd SE
- 334 Powell Rd SE
- 381 Powell Rd SE
- 381 Powell Rd SE
- 340 Powell Rd SE
- 475 Powell Rd SE
- 344 Powell Rd SE
- 512 Powell Rd SE
- 220 Powell Rd SE
- 211 Powell Rd SE
- 257 Powell Rd SE
- 255 Powell Rd SE
- 500 Druid Rd SE