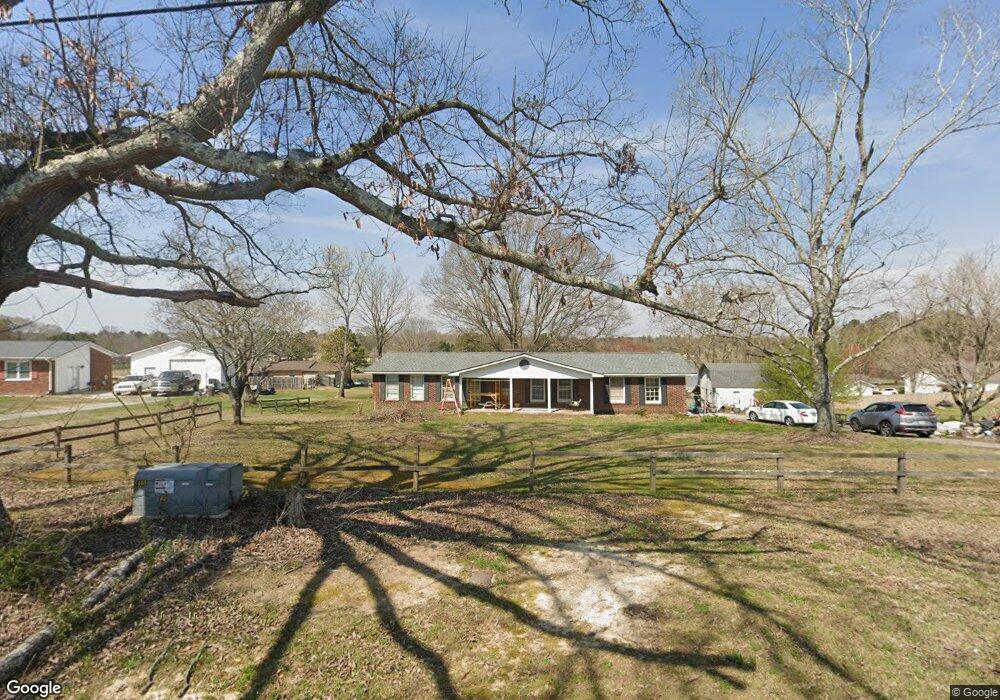
364 Stringer Rd Rockmart, GA 30153
Estimated Value: $254,000 - $272,000
3
Beds
2
Baths
1,593
Sq Ft
$165/Sq Ft
Est. Value
About This Home
This home is located at 364 Stringer Rd, Rockmart, GA 30153 and is currently estimated at $262,931, approximately $165 per square foot. 364 Stringer Rd is a home located in Polk County with nearby schools including Rockmart Middle School.
Ownership History
Date
Name
Owned For
Owner Type
Purchase Details
Closed on
Sep 23, 2005
Sold by
Brown Rodney Jason
Bought by
Mccollum Charles G
Current Estimated Value
Home Financials for this Owner
Home Financials are based on the most recent Mortgage that was taken out on this home.
Original Mortgage
$114,187
Outstanding Balance
$59,459
Interest Rate
5.72%
Mortgage Type
FHA
Estimated Equity
$203,472
Purchase Details
Closed on
Sep 23, 1998
Sold by
Mccarley James Alan and Ingle Carlotta E
Bought by
Brown Rodney Jason and Bree Purser
Purchase Details
Closed on
Aug 26, 1995
Sold by
Cagle Roy E
Bought by
Mccarley Carlott A Ingle and James Al
Purchase Details
Closed on
Jun 13, 1985
Sold by
Crigler Joy B Mrs
Bought by
Cagle Roy E
Purchase Details
Closed on
Feb 19, 1985
Sold by
Crigler Joy and Crigler Thomas
Bought by
Crigler Joy B Mrs
Purchase Details
Closed on
Jun 3, 1977
Sold by
Crigler Joy B Mrs
Bought by
Crigler Joy and Crigler Thomas
Purchase Details
Closed on
Oct 29, 1971
Sold by
Stringer Joe and Stringer Fred
Bought by
Crigler Joy B Mrs
Purchase Details
Closed on
Feb 1, 1969
Bought by
Stringer Joe and Stringer Fred
Create a Home Valuation Report for This Property
The Home Valuation Report is an in-depth analysis detailing your home's value as well as a comparison with similar homes in the area
Home Values in the Area
Average Home Value in this Area
Purchase History
| Date | Buyer | Sale Price | Title Company |
|---|---|---|---|
| Mccollum Charles G | $116,000 | -- | |
| Brown Rodney Jason | $67,000 | -- | |
| Mccarley Carlott A Ingle | $61,500 | -- | |
| Cagle Roy E | -- | -- | |
| Crigler Joy B Mrs | -- | -- | |
| Crigler Joy | -- | -- | |
| Crigler Joy B Mrs | -- | -- | |
| Stringer Joe | -- | -- |
Source: Public Records
Mortgage History
| Date | Status | Borrower | Loan Amount |
|---|---|---|---|
| Open | Mccollum Charles G | $114,187 |
Source: Public Records
Tax History
| Year | Tax Paid | Tax Assessment Tax Assessment Total Assessment is a certain percentage of the fair market value that is determined by local assessors to be the total taxable value of land and additions on the property. | Land | Improvement |
|---|---|---|---|---|
| 2025 | $1,379 | $75,968 | $6,000 | $69,968 |
| 2024 | $1,682 | $82,470 | $6,000 | $76,470 |
| 2023 | $1,259 | $55,036 | $6,000 | $49,036 |
| 2022 | $1,096 | $48,163 | $6,000 | $42,163 |
| 2021 | $1,110 | $48,163 | $6,000 | $42,163 |
| 2020 | $1,112 | $48,163 | $6,000 | $42,163 |
| 2019 | $1,068 | $41,764 | $5,015 | $36,749 |
| 2018 | $1,066 | $40,695 | $5,015 | $35,680 |
| 2017 | $1,053 | $40,695 | $5,015 | $35,680 |
| 2016 | $1,053 | $40,695 | $5,015 | $35,680 |
| 2015 | $1,066 | $41,051 | $5,015 | $36,036 |
| 2014 | $1,080 | $41,278 | $5,242 | $36,036 |
Source: Public Records
Map
Nearby Homes
- 397 Stringer Rd
- 461 Lakeview Rd
- 93 Clay Rd
- 184 Morgan Ln
- 18 Hillside Dr
- 907 Stringer Rd
- 65 Wheeler Rd
- 865 Morgan Valley Rd
- 60 Lee St
- 1714 Cedartown Hwy
- 11 Lee St
- 479 Morgan Valley Rd
- 92 Autumn Path
- 0 Pine Mountain St Unit 10620510
- 0 Pine Mountain St Unit 10620492
- 2512 Tolbert Town Rd
- 0 Tolbert Town Rd Unit 10640593
- 0 Tolbert Town Rd Unit 7678739
- 831 Government Farm Rd
- 816 Government Farm Rd
- 376 Stringer Rd
- 346 Stringer Rd
- 26 Lakeview Dr
- 14 Lakeview Dr
- 11 Lakeview Dr
- 345 Stringer Rd
- 398 Stringer Rd
- 332 Stringer Rd
- 379 Stringer Rd
- 341 Stringer Rd
- 605 Lakeview Rd
- 44 Lakeview Dr
- 36 Lakeview Rd
- 56 Lakeview Dr
- 0 Valley View Rd Unit 7058280
- 0 Valley View Rd Unit 4111957
- 0 Valley View Rd Unit 5115576
- 585 Lakeview Rd
- 56 Lakeview Rd
- 414 Stringer Rd
Your Personal Tour Guide
Ask me questions while you tour the home.